Archive for February, 2006

H+H: best (and last) of new Yaletown homes

Friday, February 17th, 2006

Other

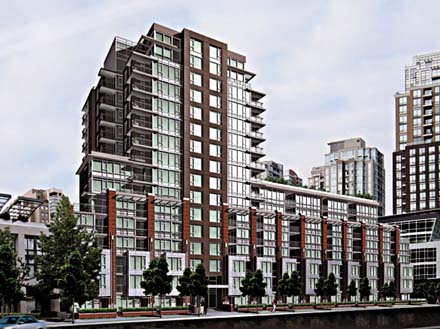
LAST OF YALETOWN: Don’t wait to claim your home at H+H in Yaletown. The designer showroom opens for previews this Saturday, February 18. It is located at 1066 Richards St., Vancouver and open daily 12 noon to 6 p.m. except Friday. Prices in the $300,000s. Visit them on the web at www.hhyaletown.com or phone 604-692-0021 for more details. Photos: Rennie Marketing

All who have longed for Yaletown are now rewarded with the homes of H+H, the evolution of an urban lifestyle that convinced Good Morning America to name Yaletown among the top five neighbourhoods on the continent.

Embodying true Yaletown living, H+H is situated adjacent to the bustling retail hub of Mainland and Hamilton Street. A two-minute stroll takes you right to the heart of Vancouver’s trendiest restaurants, nightlife spots and retail boutiques.

H+H is what life in historic and hip Yaletown is all about. The main residential tower is an exclamation point in the centre of the community, a style statement in glass and light. The suites feature clean, lean architecture with heartstopping city views. Skirting the tower are brick-walled, street-level townhomes, historic style blended to a modern industrial chic.

This is Chandler Development Group at its best. The respected family firm, with more than three generations of extensive real estate experience in Vancouver and beyond, is known for the Tribeca Lofts in Yaletown; Hamlin Mews at 38th and Oak; and Garden City in Richmond, all of which led to the perfection that is H+H. Ascending in the heart of Yaletown,

H+H looks out over heritage buildings artfully converted to boutique shops and services, and wonderful view corridors to the False Creek waterfront, Cambie Street, City Hall and the Dome.

The suite interiors come in a choice of Manhattan (silvery grey with undertones of grape for the cabinetry, limestone tiles and carpet) or Santa Monica (the natural richness of teak brown and creamy white).

 H+H kitchens welcome with brand-name stainless steel appliances, granite or quartzite counters with high-spout faucets, some even have islands and all have stainless steel backsplashes and recessed halogen lighting.

In the bathrooms, sassy stainless-steel faucets adorn the spa-white undermount sink and the relaxing tub comes with armrests. Sandblasted mirrors and imported tiles underscore the exclusive feel. Most suites feature frameless glass showers and double vanities.

The stylish living spaces are floored in giant tiles and 100 per cent wool loop carpets and feature electric fireplaces and insuite washer and dryer.

 H+H is landscaped with a green courtyard at the lane and two spacious roof gardens (one with a children’s playground) open to the sky and the city views.

And all this with the best dining, entertainment and shopping of Yaletown at your doorstep.

Don’t wait to claim your home at H+H. With prices starting in the $300,000s, these homes are selling quickly.

The H+H showroom opens for previewing this Saturday, February 18.

It is located at 1066 Richards St., Vancouver and open daily 12 noon to 6 p.m. except Friday. For more details, phone 604-692-0021 or click to www. hhyaletown.com.

Public input invited on Proposed White Caps stadium

Friday, February 17th, 2006

Naoibh O’Connor
Van. Courier

The Whitecaps vision of the 15,000-seat stadium proposed for the north foot of Cambie Street includes a plan for future expansion to 30,000 seats.

The city wants public comment at four open houses scheduled in March to display plans for the waterfront stadium proposed by the Whitecaps soccer team.

The initial proposal includes a 15,000-seat stadium, which could be expanded to 30,000 seats in the future. The stadium would sit over the rail yard between Granville Square and the foot of Cambie Street.

It would be used for Whitecaps men’s and women’s games and for other sporting events and concerts.

“This is really a fact finding mission in may ways,” said city planner Kevin McNaney. “It’s sussing out the issues, shining some light on the issues and getting a good understanding to help council make an informed decision.”

Whitecaps president John Rocha said the club welcomes public consultation. “It’s important because ultimately what we want to build is a community asset, so the more input we have from different constituents to ensure we build something that everybody can be proud of [the better],” he said.

Rocha maintains the public appears to back the proposal, which was announced last year. He cited a survey commissioned by the Whitecaps that indicated 71 per cent of respondents were very supportive or supportive of the stadium project. Eleven per cent were opposed.

Rocha said supporters liked the proposed stadium’s accessibility by transit and its availability for uses other than soccer. Opponents, he said, criticized the consultation and cited concerns about potential problems like traffic.

Rocha maintains some people were confused about the consultation, suspecting it was a done deal, which it’s not, he said.

“This is a long process to go through. [People] thought we were outlining a vision of trying to get people excited about our project [in October] and weren’t aware there was a full public process coming,” he said.

Several business groups have expressed support for the stadium, while groups such as the Downtown Eastside Residents’ Association have registered opposition. A call to DERA by the Courier was not returned.

McNaney said after the open houses, staff will bring a report to council in May.

“The thing to keep in mind about the whole study is it’s a step back study-a larger initial review to get a sense of what are the issues, where people stand on it, is it viable, is it desirable etc.,” he said. “It’s up to council to decide whether it moves forward for further planning, in which case it goes through, like any other major development, rezonings etc.”

Rocha won’t speculate on the outcome of the review. “In the end we think the project can be designed in a way that it has a whack of great community benefits. It could be a real asset to the city,” he said.

The first open house is from 2 to 8 p.m., March 6, in the W room at Woodward’s on the ground floor at 101 West Hastings St. Another is planned for 3 to 8 p.m., March 7, in the Storyeum lobby at 142 Water St.

A third is set for 2 to 8 p.m., March 8, in the Harbour Centre lobby at 555 Hastings Street, while the final one is between 10 a.m. and 4 p.m., March 11, at Vancouver Public Library, Library Square, promenade, at 350 West Georgia.

Rapid transit not viable east of Port Mann Bridge

Friday, February 17th, 2006

study: Report says it wouldn’t run close enough to major population centres

William Boei
Sun

LOWER MAINLAND – Rapid transit will not work in the Trans-Canada Highway corridor “for the foreseeable future” because new development east of the Port Mann Bridge will not be dense enough, says one of the studies done for the Gateway Program.

Gateway is a $3-billion provincial government proposal to widen the highway, twin the bridge and build new truck routes on both shores of the Fraser River by 2014.

A rapid transit line along the highway and into the Fraser Valley as far as Chilliwack has been suggested by some regional politicians — including former Vancouver mayor Larry Campbell — as an alternative to the Gateway plan.

But a study on future transit needs notes that rapid transit in the highway corridor wouldn’t run close enough to the region’s major population centres.

As for future growth, “Although there will be a significant growth in the population east of the river, it will be over a large area — significantly larger than the City of Vancouver, for example — and will tend to be less dense over the larger area,” says the study report.

That means high-capacity rapid transit for the area east of Langley is not practical “for the foreseeable future.”

In the long run, a rail-based commuter system might work if it runs on existing tracks to keep capital costs down. The report says regional planners should try to keep that option open.

“In the shorter term, the focus of transit planning in the corridor should be on providing fast, easy access to the existing rapid transit system by both bus and car,” the report says.

Lanes designated for transit over a twinned Port Mann Bridge should be used for express bus operations, possibly shared by car pools and van pools, it says. If rail transit eventually becomes practical, that space could be converted for its use.

The report also says capital costs would be too high to extend the Millennium SkyTrain line to Langley, Cloverdale and new developments along the Fraser Highway, and buses should be used in those areas.

Another report outlines a $50-million plan for cycling infrastructure in the highway corridor. Most of the money would go to build multi-use cycling and walking paths on the new Port Mann Bridge and its approaches.

About $7 million would be used to connect the bridge paths to cycling networks in municipalities adjacent to the bridge.

The report says there is also potential for $10 million in shared-cost projects to connect municipal cycling networks on opposite sides of the highway.

There would be no bicycle paths on or along the Trans-Canada, but the North and South Fraser Perimeter Roads could accommodate cyclists on their shoulders, the report says.

Another report, on land use, counters arguments that the Gateway Program will encourage strip development and urban sprawl along the highway. It says local governments have enough planning powers to “direct land development patterns towards community objectives while maintaining the benefits of transportation improvements.”

It cites several U.S. examples, including the East Portland Freeway, which was built 30 years ago and did not result in development outside designated growth boundaries.

The studies can be found on the Gateway Program’s website, www.th.gov.bc.ca/gateway/.

© The Vancouver Sun 2006

New housing plan raises fears

Friday, February 17th, 2006

‘Innovative’ change coming in 30 to 60 days

Frances Bula
Sun

SOURCE: BC HOUSING VANCOUVER SUN

Housing Minister Rich Coleman appears poised to introduce a dramatic change in how the B.C. government helps people with housing, a move that is making housing groups, poverty advocates and some city politicians nervous.

On the other side, associations representing private apartment owners and landlords are optimistic and excited that their years of lobbying for a rent-subsidy system may finally be bearing fruit.

Coleman refuses to give details about the plan, which he told The Vancouver Sun will be released in 30 to 60 days, except to say that it will be “very innovative,” “very exciting” and something that will kick off a much-needed debate about better ways to provide housing.

However, Coleman, who was Liberal housing critic during NDP years, has always supported the idea of providing rent subsidies to low-income families so they can rent from private landlords, rather than having government provide subsidies for building social housing.

He told a Canadian Home Builders Association convention in January that the era of government housing has passed and that he favours providing rent subsidies in private buildings.

“Major cities all across North America today are bulldozing their [housing] projects and they’re doing it so they can redevelop their communities and integrate people into society,” Coleman told the builders. “You want to see the worst experiment of social housing in British Columbia, go to the Downtown Eastside of Vancouver — it’s a failed experiment, because we forgot about the fact that people need to be integrated.”

That statement, plus the hints of his plan to move to rent subsidies, have outraged some and alarmed many more about his intentions.

“In the Downtown Eastside, social housing is mostly the best housing. It’s the private housing that is often quite disgusting,” said Jean Swanson of the Carnegie Community Action Project. Rent subsidies benefit landlords more than tenants and don’t provide the kind of security a subsidized unit in social housing does, she said.

Alice Sundberg, executive-director of the B.C. Non-Profit Housing Association, says Coleman is misleading people when he talks about the problems of American social housing as though it were relevant to B.C.

Sundberg says that of the almost 80,000 units of social housing in the province, 70,000 are in relatively small operations run by non-profit groups that aim to work with communities and blend in — a far cry from the infamous public housing tower-slums of Chicago or New York.

Like many housing experts, Sundberg says rent subsidies are a good idea in some circumstances and part of a toolbox of strategies any government should use. The province already provides $36 million in rent subsidies to 14,200 B.C. households, mostly seniors.

Subsidies work best for communities that have a relatively high vacancy rate or for people who have special needs, she said.

“They work very poorly in areas like the Lower Mainland, Victoria, the Okanagan, where the vacancy rate is too low.”

Rent subsidies have been favoured in the U.S. since the 1970s. Exhaustive studies comparing rent-subsidy programs to subsidized housing have indicated rent subsidies can end up concentrating low-income people in one small area where the lowest-cost private housing is available and can have the effect of pushing up rents.

But Al Kemp, the CEO of the Rental Owners and Managers Association, said he doesn’t believe that will happen under the “portable housing allowance” he believes Coleman will bring in.

Kemp said his association has lobbied for the subsidy system because “we want money to be given to the tenant.”

“We’re not an industry looking for a handout,” he said. “We’re looking to help people with an income problem.”

Vancouver housing centre manager Cameron Gray said the city will continue to help non-profits buy sites and build social housing on city land, because developing a long-term stock of affordable housing is the only thing he sees working in an expensive, growth city like Vancouver.

© The Vancouver Sun 2006

Speed-skating oval for divas

Thursday, February 16th, 2006

Builders of the massive 2010 Winter Games venue envisage an ‘internationally recognized icon’ on a par with Sydney’s famous opera house

Jeff Lee
Sun

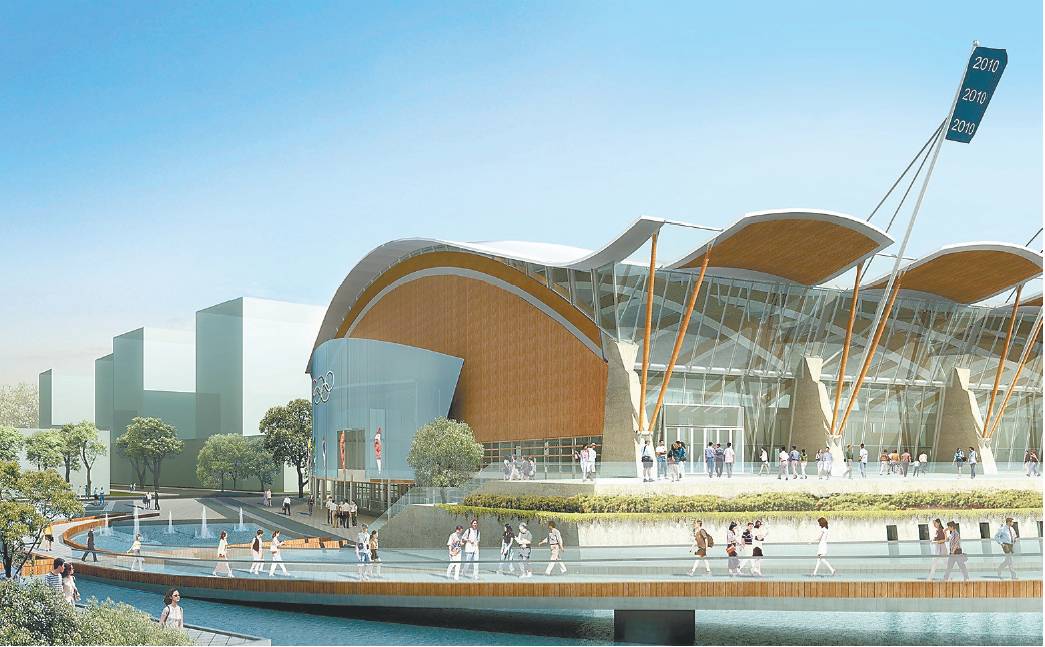
This artist’s rendering of Richmond’s speed-skating oval gives a sense of the aspiration for the building to become an internationally recognized icon, such as the Sydney Opera House in Australia.

When it is finished it will be the third largest of its kind in the world, so massive it could hold four DC-10 aircraft wingtip-to-wingtip, and so remarkable in its design that its owners hope it will be considered on a par with the Sydney Opera House.

For now, however, the Vancouver 2010 Winter Olympics speed-skating oval in Richmond is nothing more than detailed engineering and architectural plans for a site beside the Fraser River that is now covered in nearly two metres of compacting sand.

By year’s end, the home of the world’s newest speed-skating venue will be a slab of concrete covering a 450-stall parking garage. And over the late winter of 2007, the distinctive flowing line of the massive roof will begin to take shape as a crane wheels in place 15 glue-laminated beams so huge they’re each just shy of a 100-metre Canadian football field in length. They will bracket 13 huge columns that represent Canada’s 10 provinces and three territories.

This is the place that also holds the greatest promise for Canada to break its at-home gold medal drought; in neither the 1988 Calgary Winter Games nor the 1976 Montreal Summer Games did a Canadian win an event.

In 2010, spectators in Richmond may well see that drought end. Canada’s new Own the Podium program, which seeks to identify and help train athletes who can win medals, has suggested Canada could win eight of the 34 speed-skating medals.

A long-track speed-skating oval is arguably the dominant architectural venue to build in any Winter Olympics. It is an opportunity for a city or country to stamp its mark.

Lillehammer, Norway did that for the 1994 Winter Games with an oval at Hamar in the shape of an overturned Viking ship. Salt Lake, which hosted the 2002 Games, built a light, clear-span cable suspension roof that carved 950 tons off the conventional oval roof design. Calgary’s 1988 Olympic oval — still considered the fastest ice on earth — was the first covered speed-skating oval in North America.

Richmond‘s is no less unique. From the air, the roof will take the stylized native shape of a heron’s wing, a tribute to the Salish First Nation and the large wading bird that cohabited the riverbank at first contact 230 years ago. It will cover 33,000 square metres of space, including a 20,000-square-metre main floor that includes a 400-metre refrigerated track. It will easily be seen from many places in the Lower Mainland and is being built on one arm of the Fraser river, between No. 2 Road and the Dinsmore Bridge, almost under the flight path of the Vancouver International Airport on Lulu Island.

“This will become an internationally recognized icon,” said Ted Townsend, Richmond’s senior manager of corporate communications. “It will be like B.C. Place or other signature buildings, or, in a more grandiose way, like the Sydney Opera House.”

Among the factors being considered in the oval’s construction is feng shui, the Chinese art of placing objects in buildings and other places to maximize positive energy.

Sherman Tai, a 53-year-old feng shui consultant, was hired by the city of Richmond for input on the oval because of the importance of feng shui to Richmond’s large Chinese-Canadian community. Tai also provided feng shui advice for the city’s new city hall, Townsend said.

The architects behind Richmond’s striking design are Cannon Design, whose principal and lead project architect, Bob Johnston, was involved in the design of both the Calgary and Salt Lake tracks. The company has also done work for the Commonwealth and Pan American Games, and consulted for London, which won the 2012 Summer Olympics.

This is the year that Richmond’s big Olympic gamble takes shape, with construction starting on many parts of the $178-million development. Within months, contractors will begin pouring concrete for the parking garage, which will be housed under the massive oval.

It’s a gamble because Richmond is getting only $60 million from the 2010 Vancouver Organizing Committee, which moved the oval project from Simon Fraser University to keep ballooning costs under control. SFU had been the premier site for Vancouver’s submission to the International Olympic Committee, but lost it after the cost of its project escalated beyond $78 million.

Richmond came in with a different proposal: incorporate the 400-metre speed-skating oval into a major riverfront revitalization that would be used to offset additional costs.

The overall development encompasses 13 hectares on seven city-owned parcels and will ultimately include 130,000 square metres of commercial and residential space, including a proposed hotel. The city estimated in its application that it will get $54 million from that development. There will also be a new waterfront park. But until the Games are over in 2010, only the oval, parkade and public gathering place will be built.

The rest of the site will be used by Vanoc for temporary Games facilities, including parking, and broadcast and media services.

The city has also pledged not to raise property taxes to fund the project, and that another $50 million would come from nearby River Rock Casino’s revenue-sharing agreement. The remainder will come from development charges levied for nearby projects, naming rights and sponsorships.

After the Olympics, the oval will be converted to a multi-use sport facility that will include two Olympic-sized ice rinks, up to eight hardwood ball-sport courts, a gymnasium, a 200-metre track and a rubberized turf area.

The speed-skating oval will be covered with removable flooring and could still be used for competition.

But more importantly, the oval is being positioned by the city as a future home for up to six national teams, as well as a centre for sport excellence. The building will have fitness facilities for both high-performance athletes and the local community.

One of the first teams being courted is the University of B.C. rowing team, which is building a $6-million boathouse on the river just north of the oval.

The oval project is so huge that Richmond hired a raft of advisers and managers to keep it on track, and broke it into at least 23 separate contracts. Everything from roof design to pre-cast concrete to elevators to electrical and mechanical work has been sectioned off. Franklin Holtforster of MHPM Project Managers Inc. is the overall project manager. Dominion Fairmile Construction was hired as advisory construction manager, and will handle the issuance of contracts.

“We will let all the contracts this year. This project will be completely tendered this year,” said Greg Scott, Richmond’s director of major projects. He is equally confident the oval will be finished in the fall of 2008, enough time to give Canada’s athletes two training seasons before the Olympics.

So far, Richmond has issued three contracts. Clearing and grubbing of the site took place last year.

Agra Foundations just finished creating what Scott said is “a forest” of underground stone columns to densify the ground to keep it from moving. And E. Mathers Contracting just finishing pre-loading the site with 100,000 cubic metres of sand to compact it prior to construction.

The sand will remain there until April or May, after which it will be removed to allow for construction of massive concrete abutments that will be used to help anchor the roof trusses.

In January, Dominion issued a call for companies interested in bidding on 19 contracts. (One contract for finishing the building envelope, including installation of the huge glass windows, has not yet been put to tender.)

A separate super-flat concrete floor will be installed over the concrete base, between which will be sandwiched a massive refrigeration system. The skating floor and liquid-ammonia refrigeration system will be installed in 2008.

Scott said Richmond opted for wood beams rather than steel for the roof trusses to showcase B.C. products.

“There aren’t may companies that can bend steel in an arch that long and it can’t be done locally. We want to push the wood market, and esthetically it is elegant,” he said.

So far, Richmond has spent $5.9 million on developing the project, including $2.3 million for design and nearly $1 million to prepare the site.

In what may have been the shrewdest investment, however, it donated $500,000 to the Vancouver 2010 Bid Corp. in 2002 and 2003, shortly after Vancouver won the bid and while it was considering moving the oval from SFU. Vanoc awarded Richmond the venue in August 2004. With that foot in the door, the city then spent $459,000 that year and in 2005 to send staff and city council on 16 trips to examine ovals around the world.

The trips, including repeat visits to Calgary, Salt Lake City, Lillehammer and Turin, created controversy among taxpayers who wondered if all the travel was necessary.

In December, council approved another $120,000 to send nine people, including Mayor Malcolm Brodie and Coun. Bill McNulty, to Turin for the 2006 Olympics. Brodie has defended the expenses, saying the city has to get this project right and the trips helped it learn what not to do.

The project has not been without financial problems. Like other public works, it is affected by both “scope creep” and a white-hot construction market that is creating shortages in skilled labour and materials.

As an example, Scott said, the oval was costed out at $206 million after all of the project designers, engineers and interested parties were asked what they wanted to see in the oval. It was then pared back to what the city could afford.

Scott said it was similar to someone telling a developer about the dream home they want, only to have to cut out the library, swimming pool and expansive gardens once the dream’s sticker price is added up.

Ultimately, the city agreed to spend an additional $23 million over its original $155-million price to include the parkade.

WHAT TURIN IS DOING:

Venue: Speed-skating oval

Location: Turin

Size: Overall covered area: 26,500 square metres. Track size: 400 metres x 12.60 metres.

Seating: 8,463.

Number of events: 12

Distance from athletes’ village: 3 kilometres.

Post-Games use: Fairs and exhibitions in concert with the existing, and massive Lingotto Fiere convention centre, a former Fiat factory.

Cost as of 2005: 70.45 million euros, ($99 million) of which seven million euros ($9.8 million) come from the City of Turin and the rest from the federal government.

Of note: The new oval is in the centre of Turin, and a short walk from the Lingotto Fiere centre, where the main media centre is being housed. Construction began in 2003 and was finished late last year.

Source: Jeff Lee

© The Vancouver Sun 2006


Restaurant listings For February 16, 2006

Thursday, February 16th, 2006

Critic’s Picks

Sun

A list of restaurants recommended and anonymously visited by Sun restaurant critic Mia Stainsby.

Prices are per couple for three courses, with a glass of wine each, before tip and taxes.

$ means $50 or less

$$ means $50 to $100

$$$ means more than $100

– – –

– WEST COAST

Aurora Bistro The first fine dining room on Main St. Inventive food, hip spot. 2420 Main St., 604-873-9944. $$

Bishop’s Consistently one of the city’s best. Almost 100 per cent organic foods. 2183 West Fourth Ave., 604-738-2025. $$$

Bin 941 Tapas bar in tiny eclectic space. 941 Davie St., 604-683-1246. $$/$$$

Bin 942 Creative, delectable tapas dishes. 1521 West Broadway, 604-734-9421. $$/$$$

Cru Blurs the lines of fine dining, lounge and bistro. Lovely “small plates” or a four-course prix fixe. 1459 West Broadway, 604-677-4111. $$

Nu A sophisticated version of casual dining. Beautiful flavours, great atmosphere. 1661 Granville St., 604-646-4668. $$

Parkside Handsome room in residential West End, richly flavoured food. Great spot. 1906 Haro, 604-683-6912. $$/$$$

Raincity Grill A Vancouver moment by English Bay. Regional food. 1193 Denman St., 604-685-7337. $$$

West Vies for best restaurant in the city. 2881 Granville St., 604-738-8938. $$$

– ITALIAN

Cioppino’s Mediterranean Grill Fine Italian cuisine with a light touch. 1133 Hamilton St., 604-688-7466. $$$

Quattro on Fourth An Italian restaurant with flair. 2611 West Fourth Ave., 604-734-4444. $$/$$$

– CHINESE

Hon’s Wun-Tun House Slurp noodles and chomp on delicious potstickers. Huge menu. 1339 Robson St., 604-685-0871. $

Kirin Seafood Exquisite Cantonese food. City Square, 555 West 12th Ave., 604-879-8038. $$$

Sun Sui Wah Cantonese cuisine with light, finely tuned flavours. 3888 Main St., 604-872-8822. $$

Wild Rice Modern Chinese food in a sophisticated, hip setting. 117 West Pender St., 604-642-2882. $$

– JAPANESE

Tojo’s Restaurant The topper in this category. Japanese food at its best. 202 — 777 West Broadway, 604-872-8050. $$$

Toshi Sushi Tiny place always packed for the fresh, tasty sushi. 181 East 16th Ave., 604-847-5173. $/$$

Umami A hybrid of Japanese and Mediterranean, the food is ambitious and creative. Good value wines. 572 Davie St., 604-696-9563. $$

Zest Japanese Cuisine Grazing style modern Japanese menu in cool modern room. 2775 West 16th Ave., 604-731-9378. $$

– FRENCH/BELGIAN

Bacchus Restaurant Some classics, some nouveau. Expect the best. Wedgewood Hotel, 845 Hornby St., 604-689-7777. $$$

Chambar Modern Belgian food. Hot hipster scene. Chef has cooked in a three-star Michelin restaurant. 562 Beatty St., 604-879-7119. $$

Elixir French brasserie in Yaletown; bistro food, haute quality. 322 Davie St., 604-642-0557. $$/$$$

Le Crocodile Refined French with incredible wines to boot. 909 Burrard St., 604-669-4298. $$$

Lumiere Chef Rob Feenie redefines restaurants in Vancouver. Tasting menus. 2551 West Broadway, 604-739-8185. $$$

Mistral Authentic Provencal food cooked by former Michelin chef. 2585 West Broadway, 604-733-0046. $$

Pastis French bistro with a lightness of being. 2153 West Fourth Ave., 604-731-5020. $$/$$$

Apollonia Well-prepared Greek food and very good pizzas. 1830 Fir St., 604-736-9559. $/$$

The Main Friendly, funky spot. Wonderful roast lamb. 4210 Main St., 604-709-8555. $$

Simpatico Thirty-plus years old; traditional Greek restaurant with the addition of good pizzas. 2222 West Fourth Ave., 604733-6824. $/$$

Stepho’s Nightly lineups because of low prices. 1124 Davie St., 604-683-2555. $

– INDIAN

Maurya Fine Indian food in glam surroundings. 1643 West Broadway, 604-742-0622. $$$

Rangoli Vij’s casual and take-out next-door sidekick. Impressive. 1488 West 11th Ave., 604-736-5711. $

Samosa Garden Smooth sauces, lovely food, good service. 3502 Kingsway, 604-437-3502. $$

Tamarind A hip spin-off from the traditional Rubina Tandoori restaurant with modern elements. 1626 West Broadway, 604-733-5335. $$

Vij’s Dishes are a symphony of wondrous flavours. 1480 West 11th Ave., 604-736-6664. $$

Yogi’s Hip, contemporary Indian food, perfect for The Drive. 1408 Commercial Dr., 604-251-9644. $

– SOUTHEAST ASIAN

Banana Leaf Homestyle Malaysian food. 820 West Broadway, 604-731-6333 and 1096 Denman St., 604-683-3333. $$

Chi Modern take on Malaysian and Thai cuisines. 1796 Nanaimo St., 604-215-0078. $$

Monsoon An “East-West” brasserie with tropical Asian dishes, loads of atmosphere. 2526 Main St., 604-879-4001. $$

Montri Thai Restaurant Some of the best Thai food in the city. 3629 West Broadway, 604-738-9888. $$

Phnom Penh Largely Cambodian but includes Chinese and Vietnamese flavours. 244 East Georgia St., 682-5777. $

Pondok Authentic Indonesian dishes, freshly cooked. 2781 Commercial Dr., 604-872-8718. $$

Simply Thai On the A-list for Thai food. 1211 Hamilton St., 604-642-0123. $$

– SEAFOOD

Bluewater Cafe and Raw Bar Handsome spot. Impressive seafood, impressive wine list. 1095 Hamilton St., 604-688-8078. $$$

C Chef Robert Clark takes seafood to a new level. 1600 Howe St., 604-681-1164. $$$

Fish House in Stanley Park Bold and imaginative seafood dishes by the creative Karen Barnaby. 8901 Stanley Park Dr., 604-681-7275. $$$

Go Fish Fab fish and chips and much more, dished out of a catering truck, made with fish from the adjacent Fisherman’s Wharf. 1505 West First Ave., 604-730-5040. $

Joe Fortes Seafood and Chop House Fresh shucked oysters, cedar plank salmon, grilled chops. High energy. 777 Thurlow St., 604-669-1940. $$$

Rodney’s Oyster House Specializes in very fresh shellfish and oysters. 1228 Hamilton St., 604-609-0080. $$

– AMERICAN

Memphis Blues Barbecue House Slow-cooked, southern style BBQ. Delish. 1465 West Broadway, 604-738-6806; 1342 Commercial Dr., 604-215-2599. $

– VEGETARIAN

Habibi’s Lebanese food. Not the same old, same old. 1128 West Broadway, 604-732-7487. $

The Naam Wide variety of vegetarian fare. Quiet patio in summer. 2724 West Fourth Ave., 604-738-7151. $

Om Vegetarian Flavourful, fresh Buddhist-based vegetarian food. 3466 Cambie St., 604-873-6878. $

Raw Raw veggie and fruit dishes (preserves enzymes) as well as cooked. Food is 80 to 90 per cent organic. 1849 West First Ave., 604-737-0420. $

– LATIN AMERICA

Banano’s No-frills Venezuelan/Colombian cafe. Delicious arepas. 1223 Pacific Boulevard, 604-408-4228. $

Baru Casually chic South American food for discerning diners. 2535 Alma St., 604-222-9171. $$

Lolita’s South of the Border Cantina Casual Mexican food with sparkle. Lots of buzz in the room. 1326 Davie St., 604-696-9996. $$

Mexico Sabroso A slice of Mexico. Very inexpensive, authentic Mexican cafe. 440 West Hastings St., 604-688-7426. $

Rinconcito Salvadorean Restaurant Fresh Salvadorean cuisine. Lovely pupusas. 2062 Commercial Dr., 604-879-2600. $

Tio Pepe’s Yucatan food, nicely prepared. 1134 Commercial Dr., 604-254-8999. $

– MEDITERRANEAN

Circolo Italian, French, and a little bit of New York. Awesome wine list. 1116 Mainland, 604-687-1116. $$$

Provence Mediterranean Grill The menu is a marriage of French and Italian. Lovely flavours. 4473 West 10th Ave., 604-222-1980 and 1177 Marinaside Cres., 604-681-4144. $$

– EASTERN EUROPEAN, CENTRAL ASIAN

Accent Eastern European, French, Russian accents on a continental theme. 1967 West Broadway, 604-734-6660. $$

The Budapest Big doses of Hungarian comfort. Smouldering goulash soup. 3250 Main St. 604-877-1949. $

Rasputin Large selection of vodkas, wonderful live music and dishes such as grilled Georgian cornish game hen. 457 West Broadway, 604-879-6675.$$

– NORTH SHORE

Beach House at Dundarave Pier Spectacular setting for brunch by Dundarave Beach. West Coast cuisine. 150 25th St., West Van, 604-922-1414. $$$

Brown’s Restaurant and Bar Casually chic and bustling bistro with burgers, rice bowls, entrees. 1764 Lonsdale Ave., North Van, 604-929-5401. $/$$

Gusto Di Quattro Cosy, warm. Italian food. 1 Lonsdale Ave., North Van, 604-924-4444 . $$/$$$

La Regalade A truly, deeply French bistro. Wonderful atmosphere. 2232 Marine Dr., West Van, 604-921-2228. $$/$$$

Saltaire Gorgeous roof patio. Good value West Coast food. 2nd floor – 235 15th St., West Van, 604-913-8439. $$

Zen Japanese Restaurant Creative kitchen, quality ingredients. Good sake list. 2232 Marine Dr., West Van, 604-925-0667. $$/$$$

– BURNABY/NEW WEST

Anton’s Gargantuan portions of pasta. No reservations. 4260 Hastings St., Burnaby, 604-299-6636. $$

The Hart House In Tudor mansion. Exacting West Coast fare. 6664 Deer Lake Ave., Burnaby, 604-298-4278. $$$

Orange Room Casual tapas. International flavours. 620 Sixth Ave., New Westminster, 604-520-6464. $$

Pear Tree Small menu, sublime continental food. 4120 Hastings St., Burnaby, 604-299-2772. $$$

Vassili Souvlaki Greek Taverna Traditional Greek foods with no reticence when it comes to portions. 6558 Kingsway, Burnaby, 604-434-0626. $$

– COQUITLAM, POCO, PORT MOODY

Kirin Seafood Restaurant Chinese food for the discriminating palate. 2nd floor, Henderson Place, 1163 Pinetree Way, Coquitlam, 604-944-8833. $$/$$$

Pasta Polo Organic wheat pastas, pizzas. Family restaurant. 2754 Barnet Highway, Coquitlam, 604-464-7656. $/$$

– RICHMOND

The Flying Beaver Bar Funky bar overlooking the Fraser River. 4760 Inglis Dr., Richmond, 604-273-0278. $/$$

Globe at YVR Impressive food, sleek contemporary decor with view of U.S. arrivals terminal. Fairmont Hotel, Vancouver Airport, Richmond, 604-248-3281. $$$

Hon’s Wun-Tun House Noodles and delicious pot stickers, panfried or steamed. 4600 No. 3 Road, Richmond, 604-273-0871. $

Quilon Restaurant Southern Indian cuisine with notably delicious dosas. 6030 No. 3 Road, Richmond, 604-303-0011. $$

Shiang Garden Part of a successful Taiwanese restaurant chain. Impressive seafood. 2200 — 4540 No. 3 Rd., Richmond, 604-273-8858. $$

Sun Sui Wah Impressive way with seafood. 4940 No. 3 Rd., Richmond, 604-273-8208. $$

Zen Fine Chinese Cuisine Multi-coursed tasting menus and personalized dinners. Excellent. 2015 — 8580 Alexandra Rd., Richmond, 604-233-0077. $$$

– SURREY, WHITE ROCK, DELTA, TSAWWASSEN

Crescent Beach Bistro Rustic country spot. Straight ahead food. 12251 Beecher St., 604-531-1882. $$

Giraffe Charming place, eclectic West Coast menu. 15053 Marine Dr., White Rock, 604-538-6878. $$/$$$

La Belle Auberge In a heritage house in Ladner. Sublime French food. 4856 48th Ave., Ladner, 604-946-7717. $$$

Pearl on the Rock Modern Pacific Northwest cuisine with emphasis on seafood. Delicious fare. 14955 Marine Dr., White rock. 604-542-1064. $$$

Southside Grill West Coast cuisine, tasteful ambience. 1201 — 56th St., Tsawwassen, 604-948-2662. $$/$$$

– FRASER VALLEY

Bacchus Bistro At Domain de Chaberton Estate Winery. Limited hours. Mediterranean food. 1064 — 216th St., Langley. 604-530-9694. $$

Bravo Bistro Swish little bistro, run by former Delilah’s restaurant veterans. 46224 Yale Rd., Chilliwack. 1-604-792-7721. $$

© The Vancouver Sun 2006
January housing starts soar near 33-year high

Thursday, February 16th, 2006

USA Today

WASHINGTON (Reuters) — Warm weather helped housing starts soar 14.5% in January to the highest level in nearly 33 years, as groundbreaking on new single-family houses hit a record, the government said Thursday in a report showing unexpected strength in a market that had begun to slow.

The Commerce Department said January housing starts climbed to a 2.276 million unit annual rate — faster than economists’ forecasts of a 2 million unit pace. December housing starts were revised up to a 1.988 million unit pace from an originally reported 1.933 million unit rate.

January’s pace was the fastest since March 1973, but it was expected to be a blip caused by the weather. Analysts are forecasting that housing construction will slow this year as the nation’s five-year housing boom quiets down.

January’s increase in housing starts from December was the largest monthly percentage gain since March 1994, when starts rose 17%.

New construction of single-family homes increased 12.8% to a record 1.819 million unit pace in January while multifamily housing starts surged 21.9% to a 457,000 unit pace, the Commerce Department said.

Starts rose across the United States, climbing 29.2% in the Northeast, 23.7% in the Midwest, 16.9% in the West and 8.7% in the South.

Permits for future construction, an indicator of builder confidence, posted an unexpected increase, up 6.8% to a 2.217 million unit rate from December’s 2.075 million unit pace. Economists had expected permits to decline to a 2.062 million unit pace.

With mortgage rates rising, the U.S. housing market had begun to show signs of cooling after a five-year rally that shattered sales and construction records and sent house prices up more than 55% nationwide. But in the first three weeks of January, average 30-year fixed-rate mortgage rates dipped, according to data from Freddie Mac.

Those borrowing costs have begun to climb again, and economists continue to forecast a moderate slowdown in housing construction, sales and price appreciation for 2006.

In other economic news:

•The number of Americans filing claims for unemployment benefits rose to 297,000 last week, up 19,000 from the previous week. The increase was larger than economists had been expecting but it still left claims at a level indicating a strong job market.

•The Labor Department said import prices climbed an unexpectedly steep 1.3% in January as the cost of imported petroleum shot up 6.4%, first increase in fourth months.

The rise in import prices, which followed a revised 0.1% December drop, outstripped expectations for a 0.9% gain. But non-petroleum import prices edged up just 0.2% last month.

Export prices rose 0.7%, ahead of the 0.2% gain economists had expected.

The department said crude oil import prices surged 8% in January, bringing their increase over the past 12 months to a hefty 48.2%.

The sharp rise in oil costs the past year has pushed overall import prices up sharply and has heightened inflation worries at the Federal Reserve.

Metro home price gains soar to record

Wednesday, February 15th, 2006

Noelle Knox, USA TODAY
USA Today

WASHINGTON — Home prices in 72 metropolitan areas showed double-digit increases in the fourth quarter last year, a record that was probably the peak in this real estate cycle, the National Association of Realtors said Wednesday.

The number of metro areas with double-digit price increases surpassed a previous record of 69 areas with double-digit price gains in 2003’s third quarter.

The hottest area at the end of last year was the Phoenix-Mesa-Scottsdale region of Arizona, where the median home price soared 49% to $286,400.

As a state, Florida held five of the top 10 markets with the fastest price appreciation, led by the Cape Coral-Fort Myers area with a 48% jump in the median home price.

The most expensive housing market was the San Jose-Sunnyvale-Santa Clara area of California, where the median price was an eye-popping $747,000. And the best buys were in Danville, Ill., where the median single-family home fetched $63,800.

“I don’t want to say this is the last hoorah, but it certainly reflects the peak of the boom in terms of price appreciation,” said David Lereah, the NAR’s chief economist. “It wasn’t the highest quarter for price appreciation, at 13% (nationwide), but it covered a big part of the country – 72 metros is enormous.”

But he cautioned that the market is cooling fast.

Sales of existing home are falling faster than he expected. Home-price appreciation could drop to single digits this quarter, and will only be 5% for the year, down from 13% in 2005, he predicts.

In the last three months of 2005, Arkansas saw the greatest percentage increase in the number of home sales, up almost 30% from the fourth quarter 2004, followed by Alaska and by Louisiana, where residents are still trying to recover from Hurricane Katrina.

The softest market for home prices, compared with the fourth quarter 2004, was South Bend, Ind., where the median price fell more than 5% to $89,900. The six areas where the median price fell are suffering from job losses and bad business conditions that are weighing on the housing market.

“I’m still a firm believer we’re seeing a slowdown rather than a burst,” said Nicholas Buss, senior vice president of real estate finance for PNC Bank.

The national median home price for an existing single-family house was $213,000 in the fourth quarter, up 13.6% from a year earlier, when the median price was $187,500. In the third quarter 2005, the annual rate of home-price appreciation was 14.7%.

Fourth-quarter 2005 home prices

Change in median price of an existing, single-family home from fourth-quarter 2004

Metro area

Change

Phoenix-Mesa-Scottsdale, AZ

48.9%

Cape Coral-Fort Myers, FL

48.0%

Orlando, FL

42.0%

Ocala, FL

41.2%

Tampa-St.Petersburg-Clearwater, FL

32.3%

Tucson, AZ

32.3%

Virginia Beach-Norfolk-Newport News, VA-NC

31.5%

Sarasota-Bradenton-Venice, FL

30.0%

New Orleans-Metairie-Kenner, LA

29.2%

Deltona-Daytona Beach-Ormond Beach, FL

28.5%

Salem, OR

28.3%

Honolulu, HI

26.5%

Hagerstown-Martinsburg, MD-WV

26.2%

Palm Bay-Melbourne-Titusville, FL

26.0%

Farmington, NM

25.0%

Gulfport-Biloxi, MS

24.9%

Miami-Fort Lauderdale-Miami Beach, FL

23.9%

El Paso, TX

23.2%

Riverside-San Bernardino-Ontario, CA

21.7%

Spokane, WA

21.5%

Los Angeles-Long Beach-Santa Ana, CA

20.7%

Washington-Arlington-Alexandria, DC-VA-MD-WV

20.6%

Pensacola-Ferry Pass-Brent, FL

20.5%

Baltimore-Towson, MD

20.2%

Baton Rouge, LA

20.0%

Eugene-Springfield, OR

20.0%

Cumberland, MD-WV

19.7%

Portland-Vancouver-Beaverton, OR-WA

19.6%

Gainesville, FL

19.2%

New York-Wayne-White Plains, NY-NJ

19.2%

Beaumont-Port Arthur, TX

18.8%

Jacksonville, FL

18.5%

Peoria, IL

18.4%

Dover, DE

18.0%

Reading, PA

16.9%

Boulder, CO

16.8%

Mobile, AL

16.8%

Little Rock-N. Little Rock, AR

16.6%

Bismark, ND

16.0%

New York-Northern New Jersey-Long Island, NY-NJ-PA

16.0%

Allentown-Bethlehem-Easton, PA-NJ

15.6%

Jackson, MS

15.3%

Raleigh-Cary, NC

15.2%

NY: Newark-Union, NJ-PA

14.7%

Corpus Christi, TX

14.6%

Montgomery, AL

14.5%

Syracuse, NY

14.3%

Kingston, NY

14.2%

Salt Lake City, UT

14.2%

Greenville, SC

14.0%

Nashville-Davidson–Murfreesboro, TN

13.9%

Albany-Schenectady-Troy, NY

13.8%

Philadelphia-Camden-Wilmington, PA-NJ-DE-MD

13.7%

Spartanburg, SC

12.9%

Danville, IL

12.5%

Las Vegas-Paradise, NV

12.3%

NY: Edison, NJ

11.9%

Albuquerque, NM

11.7%

Binghamton, NY

11.7%

San Antonio, TX

11.7%

Seattle-Tacoma-Bellevue, WA

11.7%

Anaheim-Santa Ana-Irvine, CA

11.5%

Chicago-Naperville-Joliet, IL

11.2%

Norwich-New London, CT

11.2%

Champaign-Urbana, IL

11.0%

Oklahoma City, OK

10.9%

Sacramento–Arden-Arcade–Roseville, CA

10.8%

Springfield, MO

10.7%

Austin-Round Rock, TX

10.4%

Tallahassee, FL

10.4%

Knoxville, TN

10.1%

Charleston-North Charleston, SC

10.0%

Ft. Wayne, IN

9.7%

Charleston, WV

9.4%

NY: Nassau-Suffolk, NY

9.4%

San Francisco-Oakland-Fremont, CA

9.4%

Colordo Springs, CO

8.8%

Shreveport-Bossier City, LA

8.7%

Portland-South Portland-Biddeford, ME

8.1%

Houston-Baytown-Sugar Land, TX

8.0%

Atlanta-Sandy Springs-Marietta, GA

7.9%

Madison, WI

7.9%

Saint Louis, MO-IL

7.9%

Bridgeport-Stamford-Norwalk, CT

7.8%

Indianapolis, IN

7.6%

Columbia, SC

7.5%

Birmingham-Hoover, AL

7.4%

Decatur, IL

7.4%

Sioux Falls, SD

7.1%

Memphis, TN-MS-AR

7.0%

Greensboro-High Point, NC

6.9%

Hartford-West Hartford-East Hartford, CT

6.9%

San Diego-Carlsbad-San Marcos, CA

6.6%

Glens Falls, NY

6.2%

Kennewick-Richland-Pasco, WA

6.2%

Milwaukee-Waukesha-West Allis, WI

6.2%

Pittsburgh, PA

6.2%

Rochester, NY

6.2%

Topeka, KS

6.2%

Dallas-Fort Worth-Arlington, TX

6.0%

Trenton-Ewing, NJ

6.0%

Charlotte-Gastonia-Concord, NC-SC

5.9%

Springfield, MA

5.8%

Yakima, WA

5.5%

Buffalo-Niagara Falls, NY

5.2%

Fargo, ND-MN

5.2%

Amarillo, TX

5.0%

Bloomington-Normal, IL

5.0%

Lexington-Fayette,KY

5.0%

Appleton, WI

4.9%

Chattanooga, TN-GA

4.9%

Kansas City, MO-KS

4.8%

Worcester, MA

4.7%

Davenport-Moline-Rock Island, IA-IL

4.6%

Minneapolis-St. Paul-Bloomington, MN-WI

4.5%

Denver-Aurora, CO

4.4%

Green Bay, WI

4.1%

Des Moines, IA

4.0%

Kankakee-Bradley, IL

3.9%

San Jose-Sunnyvale-Santa Clara, CA

3.7%

Rockford, IL

3.6%

Elmira, NY

3.3%

Pittsfield, MA

3.3%

Providence-New Bedford-Fall River, RI-MA

3.3%

Omaha, NE-IA

3.2%

Columbus, OH

3.1%

Wichita, KS

3.0%

Grand Rapids, MI

2.3%

Gary-Hammond, IN

2.1%

Louisville, KY-IN

2.1%

Boston-Cambridge-Quincy, MA-NH

1.8%

Waterloo/Cedar Falls, IA

1.8%

Tulsa, OK

1.6%

Youngstown-Warren-Boardman, OH-PA

0.6%

Akron, OH

0.5%

Barnstable Town, MA

0.5%

Cedar Rapids, IA

0.3%

Toledo, OH

0.1%

Canton-Massillon, OH

0.0%

Detroit-Warren-Livonia, MI

-0.4%

Cleveland-Elyria-Mentor, OH

-0.9%

Lansing-E.Lansing, MI

-1.1%

Erie, PA

-2.9%

Springfield, IL

-2.9%

South Bend-Mishawaka, IN

-5.3%

Source: National Association of Realtors

Fourth-quarter 2005 home prices

Median price of an existing, single-family home in fourth-quarter 2005

Metro area

Median price
( thousands of dollars)

San Jose-Sunnyvale-Santa Clara, CA

747.0

San Francisco-Oakland-Fremont, CA

718.7

Anaheim-Santa Ana-Irvine, CA

699.8

Honolulu, HI

620.0

San Diego-Carlsbad-San Marcos, CA

607.4

Los Angeles-Long Beach-Santa Ana, CA

568.4

New York-Wayne-White Plains, NY-NJ

537.3

NY: Nassau-Suffolk, NY

472.4

Bridgeport-Stamford-Norwalk, CT

468.5

New York-Northern New Jersey-Long Island, NY-NJ-PA

459.6

Washington-Arlington-Alexandria, DC-VA-MD-WV

432.9

NY: Newark-Union, NJ-PA

427.6

Boston-Cambridge-Quincy, MA-NH

397.5

Barnstable Town, MA

397.3

Riverside-San Bernardino-Ontario, CA

392.3

Miami-Fort Lauderdale-Miami Beach, FL

391.2

NY: Edison, NJ

384.6

Sacramento–Arden-Arcade–Roseville, CA

380.9

Sarasota-Bradenton-Venice, FL

374.9

Boulder, CO

349.5

Seattle-Tacoma-Bellevue, WA

335.0

Las Vegas-Paradise, NV

315.9

Providence-New Bedford-Fall River, RI-MA

294.4

Cape Coral-Fort Myers, FL

293.1

Worcester, MA

289.5

Phoenix-Mesa-Scottsdale, AZ

268.4

Chicago-Naperville-Joliet, IL

265.6

Baltimore-Towson, MD

265.1

Norwich-New London, CT

262.1

Orlando, FL

261.8

Kingston, NY

260.0

Portland-Vancouver-Beaverton, OR-WA

256.6

Hartford-West Hartford-East Hartford, CT

253.8

Denver-Aurora, CO

247.5

Portland-South Portland-Biddeford, ME

245.7

Tucson, AZ

245.2

Allentown-Bethlehem-Easton, PA-NJ

243.4

Trenton-Ewing, NJ

243.1

Minneapolis-St. Paul-Bloomington, MN-WI

230.5

Madison, WI

224.6

Tampa-St.Petersburg-Clearwater, FL

223.0

Hagerstown-Martinsburg, MD-WV

221.7

Virginia Beach-Norfolk-Newport News, VA-NC

220.5

Philadelphia-Camden-Wilmington, PA-NJ-DE-MD

215.1

Milwaukee-Waukesha-West Allis, WI

211.6

Pittsfield, MA

210.7

Palm Bay-Melbourne-Titusville, FL

209.5

Colordo Springs, CO

209.2

Eugene-Springfield, OR

209.0

Deltona-Daytona Beach-Ormond Beach, FL

208.9

Springfield, MA

198.6

Charleston-North Charleston, SC

198.4

Gainesville, FL

197.7

Raleigh-Cary, NC

197.7

Salem, OR

194.1

Albany-Schenectady-Troy, NY

190.8

Dover, DE

185.7

Charlotte-Gastonia-Concord, NC-SC

183.5

Salt Lake City, UT

182.3

Jacksonville, FL

182.2

New Orleans-Metairie-Kenner, LA

181.2

Albuquerque, NM

174.1

Tallahassee, FL

172.6

Nashville-Davidson–Murfreesboro, TN

170.9

Atlanta-Sandy Springs-Marietta, GA

170.2

Durham, NC

168.7

Spokane, WA

168.6

Pensacola-Ferry Pass-Brent, FL

168.2

Austin-Round Rock, TX

167.0

Farmington, NM

166.0

Bloomington-Normal, IL

161.5

Ocala, FL

161.1

Birmingham-Hoover, AL

160.8

Kennewick-Richland-Pasco, WA

157.7

Kansas City, MO-KS

156.5

Detroit-Warren-Livonia, MI

156.2

Baton Rouge, LA

153.8

Greenville, SC

152.2

Lexington-Fayette,KY

150.7

Green Bay, WI

150.6

Glens Falls, NY

150.0

Greensboro-High Point, NC

150.0

Knoxville, TN

148.8

Columbus, OH

147.9

Des Moines, IA

147.2

Gulfport-Biloxi, MS

146.5

Houston-Baytown-Sugar Land, TX

146.3

Dallas-Fort Worth-Arlington, TX

145.5

Memphis, TN-MS-AR

144.2

Reading, PA

143.2

Champaign-Urbana, IL

142.6

Jackson, MS

142.5

Lansing-E.Lansing, MI

139.1

Saint Louis, MO-IL

138.8

Omaha, NE-IA

137.7

San Antonio, TX

136.8

Columbia, SC

136.5

Sioux Falls, SD

136.4

Montgomery, AL

136.3

Cleveland-Elyria-Mentor, OH

135.7

Yakima, WA

135.2

Grand Rapids, MI

135.1

Fargo, ND-MN

134.6

Louisville, KY-IN

134.6

Cedar Rapids, IA

133.8

Mobile, AL

133.7

Chattanooga, TN-GA

132.6

Corpus Christi, TX

131.2

Appleton, WI

129.3

Bismark, ND

129.1

Gary-Hammond, IN

128.4

Little Rock-N. Little Rock, AR

125.9

Shreveport-Bossier City, LA

125.6

Spartanburg, SC

125.6

Kankakee-Bradley, IL

123.6

Indianapolis, IN

122.0

Oklahoma City, OK

121.7

Springfield, MO

120.8

Tulsa, OK

120.0

El Paso, TX

118.4

Akron, OH

117.8

Charleston, WV

117.3

Rockford, IL

114.9

Pittsburgh, PA

114.3

Rochester, NY

112.8

Peoria, IL

112.7

Syracuse, NY

112.7

Toledo, OH

112.5

Davenport-Moline-Rock Island, IA-IL

109.2

Wichita, KS

108.7

Canton-Massillon, OH

106.1

Springfield, IL

105.9

Amarillo, TX

105.4

Topeka, KS

105.2

Beaumont-Port Arthur, TX

104.3

Ft. Wayne, IN

104.1

Buffalo-Niagara Falls, NY

99.8

Erie, PA

99.7

Waterloo/Cedar Falls, IA

99.7

Binghamton, NY

95.8

South Bend-Mishawaka, IN

89.9

Youngstown-Warren-Boardman, OH-PA

86.7

Cumberland, MD-WV

85.7

Decatur, IL

84.5

Elmira, NY

78.8

Danville, IL

63.8

Source: National Association of Realtors

Twinning Port Mann ‘tough sell’ at city council

Wednesday, February 15th, 2006

Vancouver city councillors from all parties express doubt about bridge plan and extra lane on Hwy 1

Frances Bula
Sun

The man in charge of the Gateway Project did not receive a valentine from Vancouver city council Tuesday.

In a rare show of unanimity, councillors from all parties expressed doubt and concern about the project’s plan to twin the Port Mann bridge and add an extra lane to Highway 1 from Langley to the Cassiar tunnel in the northeast corner of the city.

One after another asked whether this wasn’t just rewarding suburban councils for having created traffic problems by putting in business parks and residential developments far from transit.

Both Vision Vancouver Coun. Tim Stevenson and Non-Partisan Association Coun. Kim Capri told Gateway Project executive director Mike Proudfoot that he has a “very tough sell” ahead of him in Vancouver.

“This council has not proven itself to be united on tough issues, yet here we are speaking with one voice,” said Capri.

Proudfoot repeated several times in his 90-minute grilling by councillors that the Highway 1 changes will not bring a flood of traffic to Vancouver streets. Expanding the highway will actually make it easier to improve bus, carpooling, cycling and future rail options along the corridor, he said, while a toll on the bridge will make people think about other options besides travelling alone in their cars.

He said the Port Mann is so jammed now that buses can’t use it because it’s impossible to keep to schedules. And he said the project’s modelling of future traffic congestion predicts there will be a 17-kilometre rush-hour lineup by 2021, compared to the five-kilometre one now. That is costing the local economy $500 million a year, said Proudfoot.

But NPA Coun. Peter Ladner said people made the same arguments about the Lions Gate bridge a decade ago, claiming that “if we didn’t build a third crossing, the world would come to an end.”

In spite of pressure, the only change made was to improve, but not expand, the three-lane bridge.

“We still have some congestion there,” he said, “but somehow people work around it.”

Ladner also pointed out that according to the project’s statistics, the congestion actually hasn’t changed on the Highway 1/Port Mann bridge for the past decade, suggesting people have already adjusted.

Mayor Sam Sullivan wanted to know where the province is flexing any political muscle to demand that suburbs make some changes to “more responsible land use” in exchange for this temporary transportation fix. Both councillors Suzanne Anton of the NPA and David Cadman from the Coalition of Progressive Electors asked why the project doesn’t put more effort into other ways to reduce congestion on the bridge and highway before it starts spending money there.

Proudfoot came to council to present a brief overview of the project as part of the beginning of its community consultation, which will last until May.

Capri and others asked whether what the community has to say will make any difference at all.

Proudfoot acknowledged that it’s a provincial highway and the province can make whatever decision it feels necessary.

© The Vancouver Sun 2006

Microsoft elbows into RIM’s BlackBerry territory

Tuesday, February 14th, 2006

Major wireless carriers sign up

Andrew Mayeda, Ottawa Citizen
Sun

OTTAWA — Microsoft Corp. is taking dead aim at Research in Motion’s popular BlackBerry device with a new wireless e-mail system that will run on smart phones made by Motorola Inc. and Hewlett-Packard Co.

The world’s biggest software firm unveiled the operating system, called Windows Mobile 5.0, at the 3GSM World Congress in Barcelona Monday. Major wireless carriers such as Cingular Wireless and Vodafone Group have signed on to offer the phones.

The system, which will be compatible with Microsoft’s popular Exchange server, will “push” e-mail messages to the phones in much the same way as RIM’s software sends e-mails to the BlackBerry.

RIM has posted stellar growth in recent years by jumping to the front of the wireless e-mail market and racking up lucrative fees from carriers and corporate customers to install the company’s e-mail software. At the end of its latest quarter, the company had 4.3 million BlackBerry subscribers.

But the cloud over the company has grown darker in recent weeks as a patent dispute with U.S. firm NTP Inc. comes to a head. A U.S. federal judge will decide later this month whether the BlackBerry will be shut down south of the border.

Meanwhile, big competitors such as Nokia and upstarts such as Good Technology have been developing their own e-mail software to supplant RIM’s moneymaker. Industry observers had been expecting a new Microsoft offering for months, said Research Capital analyst Nick Agostino.

“It didn’t just come out of the blue. Actually, it was a little behind schedule,” he said. “For Microsoft, this will certainly help validate [their technology] and push the market.”

The software giant is hoping the technology will help extend wireless e-mail beyond top executives to the corporate rank and file.

“We’re at the tipping point of seeing exponential growth in this area,” Pieter Knook, Microsoft’s senior vice-president for mobile and embedded devices, told The Associated Press.

But he acknowledged, in a separate interview with Bloomberg News, that it could take more than a year before Microsoft overtakes RIM in terms of subscribers.

To promote the phones, Microsoft plans to launch a print and outdoor advertising campaign geared toward business travellers in Germany, France, Spain, Britain and the United States.

Despite Microsoft’s heft, the new system faces a number of hurdles in competing with the BlackBerry, including questions about cost, security, bandwidth capability, and the ability to operate on non-Microsoft software platforms, said Agostino.

“It’s still early days, but the Microsoft solution has its limitations.”

Neil Strother, research director for mobile devices at the NPD Group, said the announcement hardly represents a “death blow” for RIM, which has been “attacked from all sides for some time.”

“RIM has a pretty good installed base that’s fairly loyal,” he said. “The term ‘crackberry‘ was earned for a very good reason.”

© The Vancouver Sun 2006