Archive for September, 2009

REAL ESTATE: Recession ‘one of the shortest on record,’ report says

Friday, September 25th, 2009

Province

With sales increasing in more than half of 11 markets surveyed, Re/Max is saying that the worst of the recession is over for the housing industry. — NATIONAL POST

OTTAWA The worst is over in the Canadian residential-housing market, according to a new industry report that forecasts growth in the sector in the fourth quarter of the year.

According to the Re/Max Bricks and Mortar Report, “the bounce-back that began in early spring has made this recession one of the shortest on record for real estate.”

With Vancouver leading the way, sales increased in more than half of the 11 markets surveyed, and values have surpassed “recordbreaking” 2008 levels in seven of the markets.

“The strength of the residential-housing sector cross-country has taken many economists and housing analysts by surprise once again,” said Elton Ash, regional executive vice-president, Re/Max of Western Canada.

“In terms of its impact on the resale market, by historical standards, this recession was one of the mildest. . . . While there may still be some challenges down the road, the worst is definitely behind us in the housing industry.”

Low interest rates and falling housing prices in the midst of the economic downturn helped drive sales growth, Re/Max said.

Sales in Vancouver, one of Canada’s most expensive housing markets, rose 14 per cent from January to August, while sales were up 7.4 per cent in Victoria over that period, 6.2 per cent higher in Edmonton and up five per cent in Regina.

In Ottawa, where the real-estate market remained fairly steady through the economic crisis because of the city’s relatively stable employment situation, sales were up 2.4 per cent.

Nationally, the average price of a home is about $312,585, up 0.5 per cent from January to August, but there was a much larger jump in St. John’s, N.L., where the average price rose 18.1 per cent to $203,584.

There have also been substantial increases in Regina (6.4 per cent), Halifax-Dartmouth (3.5 per cent), Winnipeg (3.5 per cent) and Ottawa (3.3 per cent).

“Prices are on the upswing and inventory levels are tightening, so the push toward home ownership is expected to continue throughout the fall and possibly into early 2010,” says Michael Polzler, executive vice-president, Re/Max Ontario-Atlantic Canada.

Home sales drop 2.7% in August from July

Thursday, September 24th, 2009

Stephanie Armour
USA Today

Joel Naroff of Naroff Economic Advisors says August’s drop in sales is not unexpected. By Phil Coale, AP

Home sales waned after growing strongly the past few months, a sign that the housing recovery is still on shaky ground.

Sales of existing homes dropped 2.7% to a seasonally adjusted annual rate of 5.1 million in August, according to a release Thursday by the National Association of Realtors (NAR). In the previous four months, sales had increased 15%.

Even so, August was still the second highest level of sales activity in nearly two years.

The decline came even though interest rates fell from 5.22% in July to 5.19% in August, according to Freddie Mac. They were at 5.04% for the week ending Sept. 24.

“It’s a little disappointing,” says Lawrence Yun, chief economist with NAR, adding that the drop in sales indicates a continued need for federal stimulus efforts. “We’re on the cusp of a self-sufficient recovery. There may still be some consumer fear, and the stimulus measure is (aimed) at changing that.”

Home prices also slid. The national median existing-home price was $177,700 in August, down 12.5% from August 2008, according to the NAR report.

Prices may be down in part because distressed homes, which includes foreclosed properties, made up about 30% of sales. Homes sold at foreclosure often go for up to 20% less than traditional homes on the market.

Joel Naroff of Naroff Economic Advisors says the drop in sales does not mean that the housing recovery is faltering. Rather, he says economic indicators often fluctuate when coming out of a downturn.

“It’s normal. The lack of reality is the expectation we can consistently get better numbers every month,” Naroff says. “We’re still moving forward.”

Inventory continues to shrink in a sign that the glut of homes on the market is starting to get bought up. The inventory at the end of August represented an 8.5-month supply, down from a 9.3-month supply in July. Unsold inventory totals are 16.4% lower than a year ago.

First-time home buyers made up about 30% of those home sales.

Existing-home sales in the Northeast declined 2.2% to an annual pace of 910,000 in August, but are 5.8% above August 2008. The median price in the Northeast was $241,100, which is 10.5% below a year ago.

Existing-home sales in the Midwest fell 6.6% in August to a level of 1.14 million but are unchanged from a year ago. The median price in the Midwest was $149,900, down 10.4% from August 2008.

In the South, existing-home sales were down 3.1% to an annual pace of 1.89 million in August but are 1.6% above August 2008. The median price in the South was $157,400, which is 11.0% below a year ago.

Existing-home sales in the West declined 2.7% to an annual rate of 1.16 million in August but are 7.4% higher than a year ago. The median price in the West was $220,500, down 12.2% from August 2008.

Joyce Jiaozi delivers a taste of northern Chinese food at good value in a very basic, hole-in-the-wall setting

Thursday, September 24th, 2009

It may not be fancy, but the food is good

Mia Stainsby
Sun

Victor Feng, owner of Joyce Jiaozi tastes one of the dumpling dishes prepared by his wife Jean Yan. Photograph by: Glenn Baglo, Vancouver Sun

A handwritten sign greets you. “No change. No phone. No public washroom. No criminal attempts of any kind.”

And another: “We respect every customer but this is not a licensed premises. One must be responsible for the penalty if he/ she consumes alcohol or smokes inside.”

Check. Check. Check. Check. Check. I think I pass muster and sit down. Unpretentious is an understatement here but if you want a taste of northern Chinese food (as in Manchurian), Joyce Jiaozi might interest you.

I’ve heard the dumplings are good and that’s all I’m here for. Jiaozi is Chinese for dumplings and here, they are made by Jean (Anglicized from Erjing) Yan daily. She and husband “I-mostly-deliver” Victor Feng are from Manchuria in northeast China and the wide-ranging menu features food from that area.

“We come from Changchun,” Feng says, “and it is called a sister to Saskatchewan. We have corn and cold.”

Lamb, wheat noodles and some neighbouring Korean influences are part of the cuisine and they have savoury filled buns from an area closer to Beijing made for them. They also included some Taiwanese dishes thrown in (deep-fried pork chop with rice, beef stew with rice, deep-fried chicken with rice) as well.

We only tried but a small fraction of the 100-plus items on the menu. We ordered steamed, pan-fried and boiled dumplings ($4, $5 and $6). Pan-fried chive pockets were my favourite. Boiled dumplings with shrimp, pork, egg and chives were good; steamed beef dumplings were less good. Yan makes all the dumplings by hand daily. In Manchuria, Feng says, dumplings are eaten at New Years, but here, since they’re so popular, they make them every day.

I really liked the Korean-influenced kimchi fried rice but I’d recommend it only for people who, like me, can inhale kimchi like an industrial shop vacuum. The stir-fried chicken with celery and peanuts is a crunchy dish with bits of chili. Stir-fried lamb and vegetables, however, did not entice. Noodle soups are another specialty but I would have blacked out had I eaten any more. For those who want to delve deeply into the cuisine, there’s marinated pork ears, beef tripe and beef tendon.

Feng says the meatballs “are very special.” They have lotus root, bamboo roots and eggs mixed in.

Should you wonder about the barking coming from the back, it’s not a dog in the kitchen. It is just another pre-emptive move. You’ll find, should you need to use the washroom, there’s a big German shepherd outside the back door, doing his (I’m assuming the gender) job, showing his discontent as you approach.

Joyce Jiaozi might be a hole-in-the-wall and very basic (we noted Feng, who waits on tables, fell asleep on his book at one point and the kitchen sharply rang a bell to jar him out of his slumber) but if you know your way around the menu, there are some very good value dishes.

If you’re there for lunch or early dinner, check out Panaderia Latina Bakery a couple blocks away (4906 Joyce).

I would recommend the meringue sandwich cookies. They look like two white porcupines stuck together with lovely dulce de leche. Yum!

JOYCE JIAOZI

5171 Joyce St., 604-436-5678.

Open Tuesday to Sunday for lunch and dinner. Free delivery within 3 km and minimum order of $15.

© Copyright (c) The Vancouver Sun


Twitter is changing the business world

Thursday, September 24th, 2009

Mitch Joel
Sun

Shel Israel looks nothing like the type of person you might think is on Twitter. The 65-year-old spent years in the public relations field in San Francisco, getting journalists and others hyped about tech products. When you’re on that side of the communications fence, the individuals trying to promote their brands are never the star . . . the product is.

The Internet and the advent of “social media” have changed all of that. It has change Israel too. He now considers himself a writer, speaker and adviser on everything to do with social media (he calls himself a “Social Media Storyteller”). So, while many think that Twitter is all about how teenagers stay connected to Demi Lovato and Ashton Kutcher, it turns out that people from all walks of life (and all ages) are on Twitter. Israel has over 17,000 people following his bite-sized updates about his comings and goings.

In essence, he has become “kind of a big deal”, as the kids say, when it comes to social media. He’s also a huge proponent of Twitter as much more than self-interested 140-character bursts of blather. So much so that he authored a recently released business book titled Twitterville: How Businesses Can Thrive in the New Global Neighborhoods.

It’s amazing how much the business world has changed. From brands taking centre stage and companies speaking through that “one voice” (the brand), to many employees within a company now sharing every big moment of their lives and the happenings within their organizations on Twitter publicly. What seemed like a silly little communications platform — a simple status update tool where any individual can answer the question, “What are you doing?” with a maximum of 140 characters (the length of a mobile text message) — has become a cultural phenomenon and a new way to communicate and discover information in near-real-time. Beyond that, you can’t turn on a TV, listen to a radio show, or read a newspaper article without being inundated by calls-to-action to follow the writer, publisher, media channel, etc. on Twitter. Twitter has morphed from a public instant messaging platform into an immediate pipeline that connects you to anyone — or any business.

“This book isn’t a ‘how-to’ or ‘why-to’ about Twitter,” admits Israel during his recent cross-Canada book launch. “I tried to pick stories that would endure. The book is about me speaking to a bunch of individuals in a bunch of different companies. That includes people in private and public companies, as well as government and not-for-profit organizations. The hope is that people will pick up the book and get an idea of what they can do with Twitter for their business, based on what others have done. Hopefully, that has a shelf-life of two to three years. But beyond that, who knows? Twitter — as a new way to communicate — also shows us that things are changing faster and faster in our world.”

Part of the reason Twitter has had such widespread adoption has to do with its ease of use, coupled with the fact that that the platform works just as fast (and easily) on mobile as it does on the Internet. It has had record growth as well. According to Nielsen Online, Twitter grew 1,382 per cent between February of 2008 and the same month this year. In February 2009, Twitter had more than seven million unique visitors, just in the U.S. alone. At certain points in the year, Twitter was growing by more than 50 per cent month-over-month. While the company still struggles to define a solid revenue model, there is no denying that it has become not only popular, but an integral lifeline to the world.

And it’s a place where the news is now breaking first. We’re not talking about CNN anymore, we’re talking about YNN (the You News Network). Whether it is the plane that crashed in the Hudson River, the attacks on the hotel in Mumbai, or the dissent in Iran over recent elections, more and more of us happen to be “in the moment” as the news is happening, and are turning to Twitter to exercise the Citizen Journalist in all of us.

“There’s something happening, and none of us knows what it is. Not even Mr. Jones,” says Israel, who previously co-authored the book Naked Conversations: How Blogs are Changing the Way Businesses Talk with Customers with former Microsoft technology evangelist and blogger Robert Scoble. “We’re in a wormhole, and we’re trying to make sense of where it’s going. I think social media is fundamentally disrupting every institution in the world. Twitter is special because it allows us to behave online more like we do in everyday life — more than anything like it that came before. It’s very human and very real, and something that more and more people want the businesses they interact with to be like.”

Because of this wormhole, people like Israel are writing books about Twitter. Lots of books about Twitter. In fact, at last check, Amazon had over 15 books specifically about the phenomenon. Titles include, Twitter For Dummies, Twitter Power, The World According To Twitter, and even, Twitter Wit. What does it say about the power of Twitter when tomes of business books with hundreds of thousands of words are being published in traditional media to try and make sense of a communication platform that is changing our world 140 characters at a time?

Mitch Joel is president of the digital marketing and communications agency Twist Image.

© Copyright (c) The Vancouver Sun

Small group of residents allowed to stay while Little Mountain housing project redevelopment is fast-tracked

Thursday, September 24th, 2009

Doug Ward
Sun

Vancouver and the provincial government are fast-tracking the redevelopment of the Little Mountain housing site near Queen Elizabeth Park under an agreement that allows a small group of residents to continue living there during construction.

About 30 residents occupying 10 units will be moved into one building while most of the aging stucco complex is razed by developer Holborn Group and replaced with a mix of subsidized and market housing.

Residents in 214 other units have already moved to subsidized housing elsewhere while the oldest public housing project in Vancouver is redeveloped.

Vancouver Mayor Gregor Robertson and B.C. Housing and Social Development Minister Rich Coleman also said the building of social housing units will be a priority during the initial phase of construction.

Robertson said the city will proceed with rezoning so construction can begin quickly. Proceeds from the sale and redevelopment of Little Mountain will be used to create other social housing in Vancouver and elsewhere in B.C. He said there is also a deal between the city and province to fast-track construction this fall on four of six social housing projects in the city announced last spring.

© Copyright (c) The Vancouver Sun

Vancouver sole exception across country – Easy to buy anywhere but here

Thursday, September 24th, 2009

Stuart Hunter
Province

Marline Kolterhoff, a Vancouver realtor for 38 years, says it’s hard to buy a house for under $900,000 in the city. Photograph by: Wayne Leidenfrost, The Province

Canadian real estate remains a bargain compared to the rest of the world, but Vancouver’s red-hot market is still the country’s most expensive, according to a new study.

The Coldwell Banker study compared the average prices of “aspirational” homes — a typical 2,200-square-foot, single-family home with four bedrooms and 21/2 bathrooms — in countries worldwide.

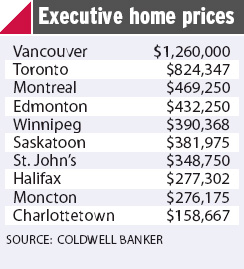
It found the home to be relatively affordable in most Canadian cities — with the exception of Vancouver, where it cost $1.26 million, making it more expensive than 35 other Canadian markets.

Toronto was the second most expensive Canadian city, with an average price of $824,347, while Montreal was third at $469,250 — all deals compared with the most expensive city globally of Singapore at $2.037 million.

Vancouver realtor Marline Kolterhoff, who has been in the business for more than 38 years, said many Canadian markets such as Burnaby, with an average price of $655,497, remain affordable.

“I think the Canadian market is still a bargain compared to the rest of the world,” said Kolterhoff, a broker/co-owner of Coldwell Banker Premier Realty. “Vancouver — relative to the rest of Canada — I don’t think it is a bargain.”

The survey found eight Canadian markets including all types of homes had average prices below $300,000 including Charlottetown ($147,560), Brantford ($222,968) and Halifax ($257,891).

The most expensive average prices in North America were in La Jolla, Calif., at $2.284 million while Beverly Hills was second at $2.126 million. Vancouver ranked 10th.

The most affordable average-priced homes in North America were in Grayling, Mich., at $120,832.

The biggest deal internationally was in Salinas, Ecuador, where the average price was $74,397.

Internationally, Milan, Italy, has the second most expensive aspirational homes at $1.76 million, with Shanghai, China, third at $1.49 million.

“When I started, bungalows were $17,000 or $18,000,” Kolterhoff recalled. “I remember a manager saying: ‘One day, these homes will be worth $100,000,’ and we all laughed and laughed and thought he was hysterical.

“Now, you can’t get anything for under $900,000. One thing about the Vancouver market — it is never dull.”

© Copyright (c) The Province


Home loan demand jumps as mortgage rates fall below 5%

Wednesday, September 23rd, 2009

Julie Haviv
USA Today

NEW YORK — Mortgage applications jumped 12.8% last week as interest rates fell below 5%, the Mortgage Bankers Association said Wednesday.

The association said its seasonally adjusted index of mortgage applications, which includes both purchase and refinance loans, for the week to Sept. 18 was at the highest level since the week ended May 22.

While consumers clamored for home refinancing loans, their appetite was also robust for applications to buy a home, a tentative early indicator of sales. The overall trend bodes well for the hard-hit U.S. housing market, which has been showing signs of stabilization.

Eric Belsky, executive director at Harvard University‘s Joint Center for Housing Studies, said several months of improvement in new and existing home sales is a positive sign.

“Low interest rates on mortgages are important to the fledgling housing recovery,” he said, and this has made a significant impact on the affordability front.

“While an uptick may bring buyers anxious that rates will keep rising into the market temporarily, a material increase in rates could threaten the rebound,” he said.

Borrowing costs on 30-year fixed-rate mortgages, excluding fees, averaged 4.97% the week ended Sept. 18, down 0.11 percentage point from the prior week and the first time since the week of May 22 the rate on this most widely used home loan was below 5%.

However, the rate remained above the all-time low of 4.61% set the week ended March 27. The survey has been conducted weekly since 1990. Interest rates were well below year-ago levels of 6.08%.

The average interest rate for 15-year fixed-rate mortgages remained unchanged at 4.41%, with points decreasing to 1.05 from 1.12.

The average interest rate for one-year ARMs slid to 6.52% from 6.61%, with points increasing to 0.28 from 0.20.

The government has embarked on an aggressive plan to bring mortgage rates down to levels that would spur demand.

Low mortgage rates, high affordability and an $8,000 tax credit for first-time home buyers — part of the government’s stimulus bill — have helped stabilize the market.

But with the first-time home buyer tax credit set to end Nov. 30 and distressed properties making up a high proportion of sales, there is uncertainty about the long-term outlook.

“While it is by no means a slam-dunk, it does feel increasingly likely that the tax credit will be extended beyond the end of November or revived some time next year,” said Celia Chen, senior director of housing economics at Moody’s Economy.com in West Chester, Pa.

The MBA’s seasonally adjusted purchase index rose 5.6% to 288.3, driven by applications for government-insured loans. The government purchase index was at the highest level ever recorded in the survey and the share of purchase applications that were government-insured was 45.7%, highest share since November 1990, the MBA said.

The four-week moving average of mortgage applications, which smooths volatile weekly figures, was up 4.3%.

The MBA’s seasonally adjusted index of refinancing applications increased 17.4% to its highest since the week ended May 29.

The refinance share of applications increased to 63.8% from 61.0% the previous week, but remained significantly lower than the peak of 85.3% the week ended Jan. 9. The adjustable-rate mortgage share of activity increased to 6.7%, up from 6.0% the prior week.

Copyright 2009 Reuters Limited.

Families are being priced out of Vancouver, study shows

Wednesday, September 23rd, 2009

Don Cayo
Sun

Vancouver families find themselves ever-harder pressed to find a place to live, especially at an affordable price. Photograph by: Glenn Baglo, Vancouver Sun files

Vancouver is growing steadily, yet the number of children, especially in east Vancouver, is plunging — one school has lost half its enrolment — because families can’t afford to live here.

While the city continues to offer plenty of choice for singles or couples to rent or to own, families find themselves ever-harder pressed to find a place to live, especially at an affordable price.

This is the nub of the findings in the first of what’s evolving into a fascinating series of Vancouver-focused research reports from BTAworks, a new research arm of Bing Thom Architects.

The first of these was a detailed look at the city’s condominiums and who lives in them. It found condos to be underrated as a source of rental housing: The majority are neither left empty by speculators and absentee owners, as the urban myth often has it, nor occupied by their owners. Rather, they are let out to tenants.

But condo rentals are heavily tilted towards studio and one-bedroom units, which aren’t suitable for families.

A second report, not yet published, shows sharp declines in east Van elementary school enrolments. The city-wide loss is more than 3,500 over five years. For the 20 per cent of worst-off schools it averages 20 per cent, and it’s almost 50 per cent for one, the small Sir William Macdonald Community School.

Private schools have siphoned off some of these students, said Andy Yan, the planner who heads the BTAworks research projects.

And some are no doubt being sent by their parents to what are perceived to be better schools, which are still showing modest increases in enrolment, on the west side of the city.

But, as the condo study shows, “Families with lower incomes are simply being squeezed out.”

Yan noted that census figures from 2001 and 2006 show that two-thirds of the population increase in Vancouver was accounted for by people over 55.

And that jibes with building statistics that show a major increase in housing that’s suitable for seniors and young singles and couples, but not families.

Eighty per cent of downtown’s 27,000 condos have been built since 1990, Yan said, and fewer than 40 per cent of them have more than one bedroom. Most are owned by people who don’t live in them, and most of these owners live elsewhere in B.C.

Typically, owner-occupied units are worth $30,000-$40,000 more — in other words, they’re larger — than rented units.

And, “A family with one child earning the median income of $75,000 a year would have difficulty in finding and paying for a condo bigger than one bedroom, even if condo prices were to fall 25 per cent below 2008 assessment levels.”

The upshot is that many families flee to more affordable suburban cities like Surrey. And, said Yan’s boss Michael Heeney, a partner in the Bing Thom firm, some — mostly skilled urban professionals who can work wherever they want — leave the region and Canada for places like Chicago or San Francisco.

The reason for the imbalance in the impact of Vancouver’s lopsided growth pattern on east-side and west-side schools isn’t fully explained by the figures. But Yan speculates it may be because the west side is a magnet for high-income people who, whether they have children or not, are less likely to be daunted by high housing costs.

“If Vancouverism 1.0 is embodied by tall, skinny towers and one-bedroom, investor-driven condominium projects for downtown Vancouver, then Vancouverism 2.0 needs to redress this imbalance,” he said.

What’s needed are creative ways to provide more affordable, family-oriented housing.

To that end, Heeney is floating the idea of a major policy change at city hall to foster the development of larger laneway housing units that would be suitable — and affordable — for families.

As it stands, the city will approve a maximum unit size of 750 square feet for laneway homes on 50-foot lots, and 500 square feet on the much more common 33-foot lots. In other words, more homes for singles, couples and seniors.

“We do not actually need more of this kind of housing,” Heeney said.

“What we do need are rental units with two or more bedrooms that can be occupied by young families.”

© Copyright (c) The Vancouver Sun

2008 Census data: Housing is getting even less affordable

Tuesday, September 22nd, 2009

Stephanie Armour and Barbara Hansen
USA Today

By Gary Crosby Jr., AP

The number of U.S. homeowners is down about 142,000

More Americans found housing unaffordable last year, even though home prices across the U.S. have taken a major fall. More than 40 million spent 30% or more of their household income on housing costs, 600,000 more than in 2007, according to 2008 Census data released Monday. That includes homeowners with and without mortgages, as well as renters.

The number of renters increased, while the number of homeowners declined.

A bright spot: The share of homeowners with mortgages spending nearly a third of their income on housing held stable in 2008, after steady increases since 2002.

Nearly two in five homeowners with mortgages and half of renters paid 30% or more of their before-tax income on housing costs, which is the limit the government sets for determining that housing is unaffordable, according to an analysis of Census data done for USA TODAY by the Joint Center for Housing Studies at Harvard University.

Housing costs for homeowners include mortgage payments, taxes, insurance and utilities. Renter costs include rent and utilities, if they are paid separately.

The prices of homes this year are down more than 20% compared with the peak of the housing bubble in 2006, according to the National Association of Realtors.

“Although housing affordability for newly purchased homes has improved, overall affordability for renters or owners is unchanged or worse because of the economy,” says Daniel McCue, research analyst at Harvard’s Joint Center for Housing Studies. “People are still hurting.”

Fewer homeowners

Reflecting the rapid pace of foreclosures, the number of homeowners dropped by about 142,000.

From 2007 to 2008 the homeownership rate fell more than half a percentage point, to 66.6% — the lowest level since 2002, says Mark Mather, a vice president at the Population Reference Bureau in Washington, D.C.

Many of those former homeowners have become renters, a segment feeling the brunt of steep housing costs. About half of renters spend at least 30% of their before-tax pay for housing.

Overall, the number of renters swelled by nearly 900,000 in 2008 compared with 2007. In the same time, renters stretching financially to make their rent rose by 601,000.

“The fact that affordability for renters is getting worse shows the impact of the economic downturn,” McCue says.

Renters are also more likely to be severely financially burdened. One in four paid half or more of their incomes for housing last year.

“The average monthly rent for a Manhattan apartment is still very high for most people,” says Matthew Baron, who co-owns a $300 million portfolio of multifamily and other buildings in the New York area. “We are also seeing a lot of people double or triple up with roommates in order to split the high rental costs.”

The new Census data show affordability remains difficult in many states, even in those hard hit by foreclosures and falling home values. Median housing costs for owners with mortgages, after adjusting for inflation, increased in 2008 from 2007 for nine states and decreased for eight states.

That’s partly because existing homeowners aren’t receiving the benefits of cheaper housing. They are often stuck in their properties, owing more than their homes are worth but unable to find a buyer.

Miami stretch

Among the top 100 metro areas, most of the top 10 least affordable ones for mortgage owners were in California and the rest were in Florida.

As in 2007, Miami-Fort Lauderdale remained one of the largest metro areas where a high percentage of homeowners spent at least 30% of their income on housing.

“Our home prices are already higher than most areas,” says Mike Premny, a broker and owner of Icon Capital Group in San Francisco. “People here understand our housing market is unique and (will pay more).”

He says banks may approve loans where borrowers put a greater amount of their income for a mortgage if they have solid credit and make large down payments.

David Kerr, a Realtor with Zip Realty in the San Francisco area, says buyers are willing to stretch because they believe their home equity will grow over time. First-time buyers especially are willing to spend a higher proportion of their incomes to become owners.

“To be able to have a house they want, it’s worth having peanut butter sandwiches for a year,” Kerr says.

 HOUSING AFFORDABILITY ACROSS THE USA


Metro

Renters spending 30% or more

Homeowners with mortgages spending 30% or more

Renters spending 50% or more

Homeowners with mortgages spending 50% or more

Akron, OH

47.1%

32.7%

24.8%

11.6%

Albany-Schenectady-Troy, NY

43.7%

31.8%

23.4%

10.5%

Albuquerque, NM

50.5%

36.9%

27.2%

14.2%

Allentown-Bethlehem-Easton, PA-NJ

46.8%

38.8%

23.1%

13.3%

Atlanta-Sandy Springs-Marietta, GA

49.6%

35.6%

24.1%

13.4%

Augusta-Richmond County, GA-SC

50.4%

30.7%

27.1%

12.5%

Austin-Round Rock, TX

49.4%

31.9%

23.9%

11.2%

Bakersfield, CA

57.3%

46.0%

29.8%

20.6%

Baltimore-Towson, MD

49.9%

36.7%

23.5%

13.4%

Baton Rouge, LA

53.5%

26.0%

29.2%

10.3%

Birmingham-Hoover, AL

46.9%

29.6%

23.3%

10.4%

Boise City-Nampa, ID

43.3%

33.4%

16.8%

12.6%

Boston-Cambridge-Quincy, MA-NH

49.3%

42.8%

25.1%

16.9%

Bradenton-Sarasota-Venice, FL

57.3%

51.2%

29.3%

25.1%

Bridgeport-Stamford-Norwalk, CT

52.8%

43.8%

26.9%

18.8%

Buffalo-Niagara Falls, NY

50.6%

29.1%

29.3%

9.6%

Cape Coral-Fort Myers, FL

54.4%

56.1%

25.9%

25.9%

Charleston-North Charleston-Summerville, SC

52.7%

37.1%

26.5%

13.6%

Charlotte-Gastonia-Concord, NC-SC

43.0%

30.5%

21.5%

10.4%

Chattanooga, TN-GA

50.3%

31.5%

23.7%

10.5%

Chicago-Naperville-Joliet, IL-IN-WI

50.2%

43.8%

27.0%

17.8%

Cincinnati-Middletown, OH-KY-IN

46.8%

30.0%

23.4%

10.6%

Cleveland-Elyria-Mentor, OH

51.1%

34.2%

28.0%

12.4%

Colorado Springs, CO

45.7%

34.4%

21.2%

12.4%

Columbia, SC

49.1%

26.7%

24.7%

9.9%

Columbus, OH

46.1%

30.3%

22.2%

9.5%

Dallas-Fort Worth-Arlington, TX

48.0%

32.4%

22.2%

11.5%

Dayton, OH

48.8%

28.7%

24.9%

9.5%

Denver-Aurora, CO /1

50.9%

37.7%

25.1%

13.8%

Des Moines-West Des Moines, IA

44.5%

26.1%

24.1%

7.5%

Detroit-Warren-Livonia, MI

52.8%

38.3%

28.6%

15.1%

El Paso, TX

52.0%

34.6%

26.9%

13.2%

Fresno, CA

57.2%

49.4%

31.0%

20.7%

Grand Rapids-Wyoming, MI

51.0%

33.4%

26.7%

11.8%

Greensboro-High Point, NC

46.1%

32.8%

22.0%

12.1%

Greenville-Mauldin-Easley, SC

46.0%

27.2%

22.8%

11.6%

Harrisburg-Carlisle, PA

41.1%

27.9%

21.3%

9.2%

Hartford-West Hartford-East Hartford, CT

50.1%

36.5%

27.0%

12.5%

Honolulu, HI

56.2%

47.4%

29.1%

19.0%

Houston-Sugar Land-Baytown, TX

45.9%

32.2%

20.9%

12.2%

Indianapolis-Carmel, IN

47.8%

28.0%

22.3%

8.8%

Jackson, MS

54.3%

28.0%

30.3%

10.9%

Jacksonville, FL

50.2%

39.4%

22.3%

13.9%

Kansas City, MO-KS

42.9%

28.2%

20.4%

9.3%

Knoxville, TN

45.2%

28.9%

24.2%

10.0%

Lakeland-Winter Haven, FL

51.5%

42.7%

25.2%

18.2%

Las Vegas-Paradise, NV

50.2%

50.9%

23.0%

21.6%

Little Rock-North Little Rock-Conway, AR

50.6%

26.3%

26.8%

8.0%

Los Angeles-Long Beach-Santa Ana, CA

56.4%

55.0%

29.1%

26.3%

Louisville/Jefferson County, KY-IN

45.6%

29.0%

23.6%

10.5%

Madison, WI

46.7%

34.2%

22.8%

9.4%

McAllen-Edinburg-Mission, TX

54.7%

43.2%

31.6%

18.6%

Memphis, TN-MS-AR

53.7%

34.7%

29.1%

14.0%

Miami-Fort Lauderdale-Pompano Beach, FL

62.6%

57.2%

33.7%

28.8%

Milwaukee-Waukesha-West Allis, WI

48.3%

35.5%

24.7%

12.1%

Minneapolis-St. Paul-Bloomington, MN-WI

50.6%

35.7%

23.5%

11.8%

Modesto, CA

58.1%

55.7%

31.7%

25.3%

Nashville-Davidson–Murfreesboro–Franklin, TN

47.2%

31.1%

22.0%

10.0%

New Haven-Milford, CT

54.8%

44.0%

28.8%

16.0%

New Orleans-Metairie-Kenner, LA

58.1%

35.6%

31.3%

15.3%

New York-N. New Jersey-Long Island, NY-NJ-PA

50.6%

48.9%

26.8%

22.1%

Ogden-Clearfield, UT

39.3%

35.6%

17.6%

9.5%

Oklahoma City, OK

46.2%

26.2%

23.7%

8.8%

Omaha-Council Bluffs, NE-IA

45.6%

28.1%

22.0%

7.8%

Orlando-Kissimmee, FL

57.2%

49.5%

29.5%

21.5%

Oxnard-Thousand Oaks-Ventura, CA

54.9%

53.9%

24.2%

22.9%

Palm Bay-Melbourne-Titusville, FL

54.4%

46.1%

27.2%

19.3%

Philadelphia-Camden-Wilmington, PA-NJ-DE-MD

50.8%

37.5%

27.2%

13.8%

Phoenix-Mesa-Scottsdale, AZ

50.2%

41.9%

23.6%

16.7%

Pittsburgh, PA

46.2%

28.9%

24.0%

9.9%

Portland-South Portland-Biddeford, ME

54.7%

40.1%

27.4%

13.9%

Portland-Vancouver-Beaverton, OR-WA

47.7%

41.3%

23.1%

14.6%

Poughkeepsie-Newburgh-Middletown, NY

52.8%

46.0%

27.3%

17.2%

Providence-New Bedford-Fall River, RI-MA

48.2%

43.0%

24.4%

16.7%

Provo-Orem, UT

46.2%

36.8%

19.8%

12.6%

Raleigh-Cary, NC

46.3%

27.2%

20.8%

8.7%

Richmond, VA

49.6%

32.1%

23.4%

9.8%

Riverside-San Bernardino-Ontario, CA

59.8%

56.2%

32.0%

26.1%

Rochester, NY

52.0%

30.0%

29.7%

9.9%

Sacramento–Arden-Arcade–Roseville, CA

52.0%

50.3%

24.7%

19.7%

St. Louis, MO-IL

47.3%

29.8%

24.0%

10.5%

Salt Lake City, UT

42.9%

34.0%

19.5%

12.0%

San Antonio, TX

50.6%

31.5%

25.4%

11.6%

San Diego-Carlsbad-San Marcos, CA

55.4%

54.4%

28.3%

25.2%

San Francisco-Oakland-Fremont, CA

49.5%

53.0%

25.1%

23.4%

San Jose-Sunnyvale-Santa Clara, CA

44.0%

51.4%

20.7%

21.3%

Scranton–Wilkes-Barre, PA

42.8%

31.7%

20.7%

11.5%

Seattle-Tacoma-Bellevue, WA

48.1%

43.9%

22.6%

15.2%

Springfield, MA

53.8%

38.1%

27.9%

13.4%

Stockton, CA

57.3%

55.0%

31.3%

24.4%

Syracuse, NY

52.3%

26.8%

27.2%

8.7%

Tampa-St. Petersburg-Clearwater, FL

54.8%

46.7%

27.0%

19.0%

Toledo, OH

51.3%

33.6%

28.6%

11.7%

Tucson, AZ

52.2%

39.2%

27.4%

14.7%

Tulsa, OK

45.5%

27.1%

21.3%

9.9%

Virginia Beach-Norfolk-Newport News, VA-NC

50.8%

39.0%

23.7%

12.1%

Washington-Arlington-Alexandria, DC-VA-MD-WV

46.9%

39.8%

21.5%

14.7%

Wichita, KS

47.7%

22.9%

22.7%

7.1%

Worcester, MA

44.5%

36.8%

18.7%

12.5%

Youngstown-Warren-Boardman, OH-PA

49.1%

33.0%

26.1%

13.3%


U.S.

49.8%

37.7%

25.1%

14.7%


Note: Housing costs include rent or mortgage payment, taxes, insurance, utilities
Source: Analysis of Census data by Harvard’s Joint Center for Housing Studies


Canadians’ confidence in economy growing

Tuesday, September 22nd, 2009

Province

Canadian economic optimism is hitting levels not seen in nearly two years, according to a poll released Monday that suggests an increasing number think the economy will gain ground in the next six months.

According to the Nanos Economic Monitor, a quarterly snapshot of the country’s economic mood, Canadians are more confident about the strength of the economy than they were in the spring, with 45 per cent saying they believed the economy would improve in the coming months, up 15 points from May.

“This is the highest level of optimism since November 2007, where the strength rating registered at 49 per cent,” said Nik Nanos, president and CEO of Nanos Research.

That level of optimism is not just felt in isolated pockets which might have been sheltered from the global economic downturn.

A rebounding housing market is behind some of that confidence, according to Nanos, with 50 per cent of respondents saying they believe real-estate values in their communities will stay the same, while 35 per cent think they will increase in six months, up nine points from May.

Sixty-six per cent of respondents said their jobs are somewhat secure and only 16 per cent reported being worried about losing their income, but 34 per cent said they were worse off financially than a year ago.

© Copyright (c) The Province