Foreign buyers are fuelling a seismic spike in Vancouver’s luxury housing market, realtors say
Julie Gordon
The Vancouver Sun
Home values in a handful of luxury enclaves in Vancouver’s west climbed more than 50% over that period, driving city-wide values up more than 35%
The impact of the latest inflow of foreign cash is particularly acute for Vancouver, its market already tight because of limited building space and a decade-long nationwide property bull run fuelled by low borrowing costs. Canadian Press
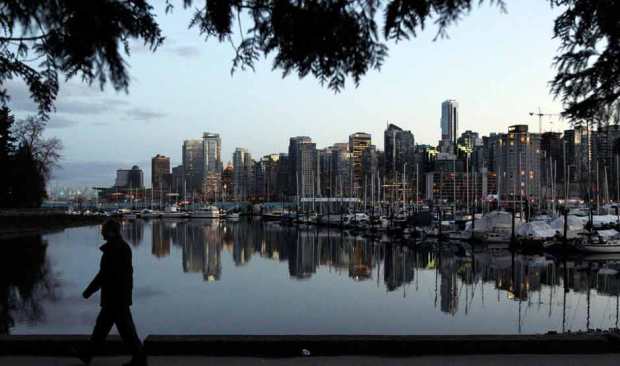
Chinese investors’ global hunt for prime real estate is helping drive Vancouver home prices to record highs and the city, long among top destinations for wealthy mainland buyers, is feeling the bonanza’s unwelcome side-effects.
The latest wave of Chinese money, linked in part to Beijing’s anti-graft crackdown, is flowing into luxury hot spots. But it has also started driving up housing costs elsewhere in a city which already ranks as North America’s least affordable urban market.
For decades Vancouver, along with Hong Kong, Sydney and Singapore and more recently New York and London has been attracting Chinese and other Asian buyers.
And just like those other cities, Vancouver got caught in the most recent buying frenzy, which realtors say has intensified after President Xi Jinping announced his anti-corruption crusade in late 2012.
“In the last year there’s been the corruption crackdown in China and a lot of people have seen their wealth evaporate over there because of that,� said Dan Scarrow, a vice president at MacDonald Realty.
“So they want to put it somewhere they perceive as safe and there’s nowhere safer than the west.�
Canada does not track foreign property buyers, but analysis of city assessment data carried out by a leading urban planner and made available to Reuters helped identify Vancouver’s hottest neighbourhoods. Interviews with realtors active in those areas confirmed the perception that Chinese buyers were largely behind the latest rally.
Andy Yan of Bing Thom Architects found that values for detached homes in the $2-5 million range have risen by 49% since 2009, making it the fastest growing segment in Vancouver’s housing market. Home values in a handful of luxury enclaves in Vancouver’s west climbed more than 50% over that period, driving city-wide values up more than 35%.
Realtors are saying that more than half of buyers in prime markets are mainland Chinese.
“My market, the luxury real estate market, is primarily Asian buyers – mostly from mainland China,â€? said realtor Malcolm Hasman, a partner at Angell Hasman and Associates. Hasman said Asian buyers accounted for roughly 90% of sales of properties costing $5 million and more.
The impact of the latest inflow of foreign cash is particularly acute for Vancouver, its market already tight because of limited building space and a decade-long nationwide property bull run fuelled by low borrowing costs.
However, its headaches might offer a glimpse of things to come for other world cities that attract global capital.
Sales volumes for detached luxury homes soared in Vancouver by 38% in the first half of 2014 compared with the year earlier period, led by properties valued at or above $2 million, according to a report by Sotheby’s International Realty Canada.
“Foreign investors are competing with other wealthy Canadians and there’s a lot of demand,� said Ross McCredie, chief executive of the luxury-focused realty firm.
Over the past 12 months, the benchmark price for a detached home in western Vancouver rose 10% to a record $2.28 million, according to the Real Estate Board of Greater Vancouver.
Nowhere is the China effect more apparent than at the top end of the market.
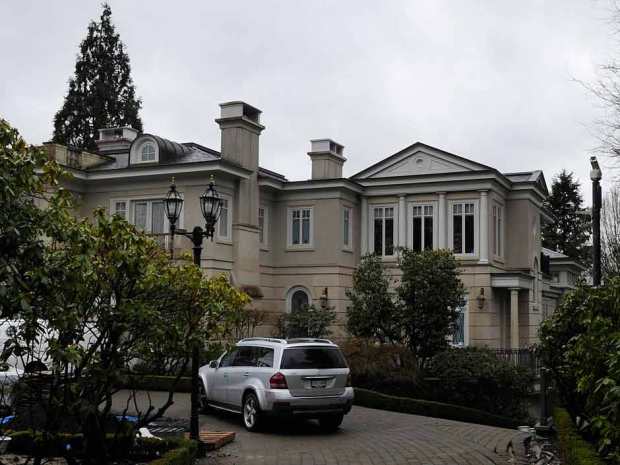
An English-style estate on a one-acre lot in Vancouver’s exclusive First Shaughnessy neighborhood is on sale for $17.9 million and all 10 offers it has attracted so far are from ethnic Chinese buyers. All are either newcomers or those who have arrived in the past decade, according to the listing agent.
“It’s all about status,� said Sherry Chen, a realtor with Rampf-Anderson Real Estate Group, who deals mainly with wealthy clients from mainland China.
In most cases, these are “astronaut families� where the husband keeps working in Asia flying back and forth, while the wife establishes an education base for the children in Canada.
Close correlation between high-end property prices and the discontinued “millionaire visa� program for wealthy individuals has raised concerns that its termination this year could hurt the market. But prices seem to have recovered after a temporary dip, McDonald Realty’s Scarrow said, adding that property investors had several other ways of accessing the market.
The money flow has transformed the DNA of the city. Condo towers are now built without a fourth floor, as that number is unlucky in Asian cultures, and wok kitchens – a second kitchen for cooking with a smoky wok – are standard in most new homes.
The influx is also having a trickledown effect as people sell out in prime locations and move to other neighborhoods driving up prices and widening the gap between housing costs and the condition of the local economy.
“We are in this unprecedented situation right now in terms of housing prices and how quickly they’ve escalated. They’ve become completely disconnected from local incomes,� said Geoff Meggs, a Vancouver city councillor.
Vancouver has ranked the second least affordable major city after Hong Kong for the past three years in an annual survey by think-tank Demographia which tracks housing costs and incomes in top markets such as New York, Sydney, Singapore and London.
That raises fears of brain drain and concerns about the markets excessive reliance on foreign money.
“I think Vancouver faces challenges a number of cities are facing in the world,� said Yan. “And that is what does one do in this new environment of global capital and money flows.�
© 2014 National Post