Archive for November, 2019

Squamish nation’s Kitsilano development promises to be transformative

Saturday, November 16th, 2019

The Squamish Nation’s proposed 6,000-unit housing development for Kits Point promising

Randy Shore
The Vancouver Sun

The Squamish Nation’s proposed 6,000-unit housing development for Kits Point promises to be transformative for the band’s members, the city and even local schools.

“Lots of our members are interested in housing options at the site, both in rental and strata ownership,” said Squamish Coun. Khelsilem. Up to 200 units could be set aside for nation members.

Several dozen Squamish Nation members attended the first of eight open houses on Thursday, many of them armed with questions about how the Senakw development will affect their future.

About 3,000 Squamish members are eligible to vote in a referendum administered by Indigenous Services Canada on Dec. 10 to decide whether to proceed with the $3-billion project.

The nation has already let the ministry of education know that Squamish families will likely move into the project and that their children should be considered in any plans to upgrade local schools, he said.

“Henry Hudson Elementary is due for an upgrade, but if they are going to build a new school, the province should work with us,” said Khelsilem. “Indigenous people have the right to have control over the education of our children.”

Senakw will offer mainly rental units and “no more than 30 per cent” strata-titled homes.

“That decision will be made as we evaluate the market, as each phase is built,” he said. “That will allow us to adjust to what the market has an appetite for, so we won’t lock ourselves into those decisions.”

The entire project could take 20 years to build.

Senakw is proposed as a 50-50 partnership between the nation and developer Westbank, and its rental-heavy mix is designed to generate long-term revenue.

“There were some questions about the partnership with Westbank and how we came to that split,” he said. “People were interested in how the revenue would be spent once it starts coming in and what the process would be in making those decisions.”

Attendees were also interested in the nation’s efforts to secure jobs for their members in the construction and operation of the development, “which has been a part of the conversation with Westbank from the beginning.”

People were generally supportive of the size and design of the project, sentiments that were generally echoed in the larger community and the media, he said.

“This is a story about land-use and city-making decisions, but it’s also about the expanding power of First Nations in our territory,” said Khelsilem.

The Squamish were forcibly removed from the site of the project in 1913 and won the land back through a lengthy legal battle.

“The media covered some of the high-level concepts around the density and parking, things that people are concerned about,” he said. “People understand this isn’t a typical development, it’s a First Nations government taking control of that land and doing it for the benefit of an Indigenous community.”

More open houses are scheduled for Seattle and locations around southwestern B.C. in the coming weeks, including sessions for youth and elders and a Facebook Live interactive event.

If the referendum is successful, the nation will begin consultations with the neighbouring community next year.

© 2019 Postmedia Network Inc.

New home price index launched to improve data availability

Friday, November 15th, 2019

Canadian home prices become more transparent with new index

Steve Randall
REP

Information about Canadian home prices is about to become more transparent thanks to a new index.

The Resale Residential Property Price Index has been created through a new collaboration between Teranet Inc., National Bank of Canada, and Statistics Canada.

The three-way partnership has built the index to form part of StatsCan’s new Residential Property Price Index (RRPI) which has been released for the first time this week in response to the federal government’s request for better access to housing market data.

“We are very excited to be collaborating with National Bank and Statistics Canada on this endeavor,” said John Robinson, Vice-President Commercial Solutions at Teranet. “Our combined strengths and capabilities are ideally suited to deliver new, valuable market insights to Canadians.”

The Resale Residential Property Price Index will produce data on the house and condo segments for Montreal, Ottawa, Toronto, Calgary, Vancouver, and Victoria CMAs.

“We’re pleased to partner with Teranet and Statistics Canada in the release of the Resale Residential Property Price Index,” said Darren Ablett, Managing Director & Head, Mortgage Business, Global Funding & Treasury at National Bank. “We’re committed to providing Canadians with greater insight and analytics in the housing market to support them in the decision-making process. The Resale Residential Property Price Index will help make information on housing even more accessible.”

New index stats

The new Residential Property Price Index shows how property prices in the six tracked CMAs have changed over roughly 2-year time periods.

From the first quarter of 2017 to the third quarter of 2019, residential property prices have increased 9.2% but most of this was before the second quarter of 2018.

Prices for new properties (+6.4%) rose at a slower pace than those of resale properties (+10.5%) but in both sectors, condominium apartment prices (+18.9%) rose at a much faster pace than house prices (+5.8%).

Among the other highlights of the index:

  • Prices in Toronto gained 9.8% from Q1 2017 to Q3 2019. This was mostly due to Q2 2017 (excluding condo apartments) with a rise of 8.4%.
  • Toronto condo apartments gained 29.8% from Q1 2017 to Q3 2019.
  • Ottawa home prices gained 18.4% since Q1 2017. The largest gain (3.9%) was in Q2 2019.
  • Vancouver prices were up 9.1% from Q1 2017 to Q3 2019 with condo apartments up 18.9%. But since Q2 2018, overall prices have dropped 5.5%.
  • Victoria has seen a 14.3% rise in prices from Q1 2017 to Q3 2019 with new condo apartments prices rising 35.2%, the largest gain nationally.
  • Calgary’s residential prices were down 3% from Q1 2017 to Q3 2019 with the sharpest drop occurring in the price of new condo apartments (17.3%).
  • Montreal prices were up 14.1% from Q1 2017 to Q3 2019 with the resale homes market contributing the most to this (17.2%).

Copyright © 2019 Key Media Pty Ltd

Reverse mortgage growth fuelled by wealthier, more active seniors

Friday, November 15th, 2019

Canada’s reverse mortgage is the fasters-growing debt

Ephraim Vecina
Mortgage Broker News

Canada’s reverse mortgage debt grew by 1.33% month-over-month in August to reach yet another new high of $3.83 billion, according to latest data from the Office of the Superintendent of Financial Institutions.

This represented a 26.23% annual increase, with $50.63 million of the total volume coming from August alone. Over the past year, Canadian boomers and seniors have borrowed approximately $796.11 million.

Together, these trends have made reverse mortgages one of the nation’s fastest-growing debt segments, real estate information portal Better Dwelling stated in its analysis of the OSFI filings.

Around two months back, Equitable Group CEO Andrew Moor said that reverse mortgage applications have essentially tripled in volume over the past year alone.

“We’ve only been in this market for 18 months, but applications are jumping,” Moor told Bloomberg in an interview last September. “Canadians are getting older and there is an opportunity there.”

This supported the observations of Canada Mortgage and Housing Corporation, which noted that the nation’s seniors are becoming even more active in in the housing market – especially in Toronto, where the proportion of the senior population (those aged 65 and over) owning homes has increased by 4.5% between 2006 and 2016, ending up at 25%.

CMHC cited increased labour force participation as the major factor in greater ownership among seniors.

“In 2016, employment became the primary source of income (including self-employed) for close to one-third of homeowner households, compared to 20% among renters. With more seniors working, fewer have been reliant on income from government sources compared to a decade ago,” the report stated.

“Among homeowners, there has been a strong increase in the share of retirees for whom pensions (public and private) were their primary source of income. These trends have translated into faster income growth for seniors.”

Copyright © 2019 Key Media

Richard Robbins Video on REBGV October 2019 Market Update

Friday, November 15th, 2019

Richard Robins
other

Richard Robbins Video on REBGV October 2019 Market Update


00:01

– Hey everyone, Richard Robbins here.

00:02

Well, the numbers are in for the real estate board

00:04

of Greater Vancouver, and I got nothin’ but good news.

00:09

Maybe one little piece of bad news,

00:11

but other than that, all good news.

00:12

Hey, at the end I got a brand new slide for you.

00:15

And what the slide is, it’s a line graph

00:17

that’s gonna show you the amount of sales that took place

00:20

month to month, for the last three years.

00:23

A great slide to maybe consider using

00:25

in your listing presentations and working with buyers.

00:28

So let’s go ahead and get started.

00:30

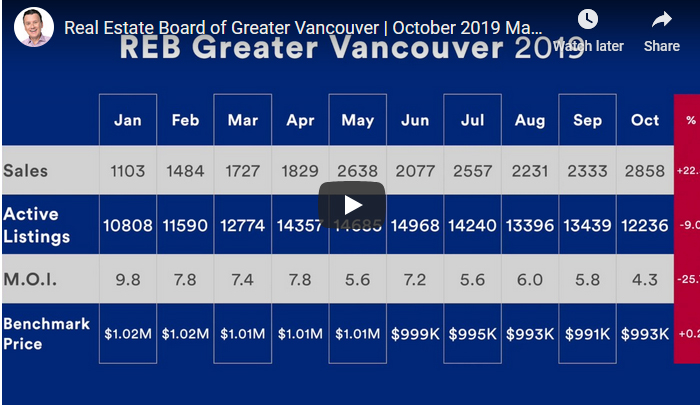
Here we go, January through the end of August.

00:33

Look at this, 2858 sales.

00:36

That’s up 22% over September.

00:39

That is a really big number, and we look at

00:42

our active listings, we had 12,200

00:46

and that is down 9% over September.

00:50

So, if our sales are up 22%,

00:52

our active listings are down 9%,

00:55

what should be happening to our months of inventory,

00:57

which determines your price, your supply and demand,

01:00

obviously going way down, it’s down 25.7%.

01:05

Now as I always say, your four to six months

01:07

of inventory is balanced, above six is going to be

01:10

a buyer’s market, your prices are weakening,

01:12

below four it’s going to be a seller’s market,

01:14

and your prices are strengthening.

01:16

Look at this, we have moved right into

01:18

a balanced market, everybody.

01:20

Look where we started, 9.8, almost 10 months

01:23

of inventory, and you can see what’s going on here,

01:26

and now we’re at 4.3, not far off.

01:29

Starting to move into an area where you’re gonna see

01:32

possibly your prices of certain properties

01:34

really start to increase.

01:36

So all very good news.

01:37

You can even see here, our prices were almost exactly

01:40

stable, up .2% over the month before.

01:45

But let’s look at this right here.

01:46

Sales, you did 1966 last October.

01:49

2858, that’s up by 45%!

01:53

This is a huge number, right here.

01:56

And then what about price?

01:57

Well yes, your prices are down year over year, why?

02:00

Because, very much at the end of last year,

02:02

most of the first part of this year,

02:04

you’re in a buyer’s market where prices were falling,

02:07

but now again as I showed you back here,

02:09

prices are now starting to stabilize a little bit.

02:11

And of course, what you’re gonna start to see,

02:13

is you’re probably going to start to see this increase.

02:15

If not at the end of this year, you’re gonna start to see

02:18

that increase definitely as we get into the first

02:20

part of next year.

02:21

So basically, all good news here.

02:23

Look at this one here, this is your months of inventory

02:26

for the last three years.

02:27

Now, this has got nothing to do with how many sales.

02:30

This is only supply and demand, months of inventory.

02:34

So look at it, 2017 we’re just above four.

02:38

Obviously really strong here, we get down to two.

02:41

You know, crept along at two, back up around three,

02:44

and we ended the year at 3.5.

02:46

What happened in 2018?

02:49

Look where we started, way up here, was pretty-

02:51

I should say, right here at four, and then

02:54

we were pretty balanced, but then what happened

02:56

is we moved into the middle of the year,

02:58

it just kept creeping up, kept creeping up

03:01

till we get to 9.6.

03:03

Of course, we started this year

03:05

at almost 10 months of inventory; very, very high.

03:09

It came down a little bit as we get into the spring,

03:11

as it generally does, May it dipped a little bit,

03:14

but you’re still sitting here, and very close

03:16

to a buyer’s market, back up to a buyer’s market.

03:19

We’re over six, and then look what’s starting to happen.

03:21

We dropped down below last year’s line, do you see that?

03:25

This is really important.

03:26

So we dropped down below 2018, okay,

03:29

and you can see the gap here is increasing, isn’t it?

03:32

Which is a very good sign, I suspect you’re going to

03:35

see this continue for the rest of the year.

03:37

Where you’re going to see we’re substantially below

03:39

what we did in 2018.

03:41

When we get down to where we were here in 2017,

03:44

I don’t know for sure, but this is all really good news.

03:47

Completely moving the right way,

03:49

and I’ll be honest, this market has responded

03:53

to what’s been going on, quicker than I thought.

03:56

In other words, we’re starting to see it crack

03:59

very, very quickly.

04:00

I thought it would have taken a little longer.

04:02

But anyway, all good stuff.

04:03

So here’s your new graph.

04:05

So you can see what this is, is this is the amount

04:07

of sales that took place in the month.

04:10

And we’ve got 2017, 18′, and 2019.

04:14

So look at 2017, obviously, look at the sales.

04:17

Over 3000, over 3000, we get up here we’re 4000,

04:21

almost 4000, so you can see 2017, it was crazy good, right?

04:26

Then what happened, moving to 2018,

04:29

started here and of course, we’re down substantially.

04:32

You see the gap, okay?

04:34

Big difference right here.

04:36

So this is a really cool graph that you could be showing,

04:38

and we’re down here and you can see there’s

04:40

a pretty big gap between 2017 and 2018, in terms of sales.

04:45

Your sales were off a lot.

04:47

Then we started here, huge gap, right?

04:50

Beginning of 2019, well below the year before,

04:54

way below two years ago, then all of a sudden

04:57

what started to happen here?

04:59

We broke through.

05:00

And we went above what was going on last year,

05:03

and look, we stayed above that.

05:04

So you can see now, now there’s a gap between

05:07

2018, and this gap got pretty big right here, look at this.

05:11

Almost reaching what we did in 2017.

05:14

So a really cool graph, actually both of these right here,

05:18

I think are very useful in terms of presentation.

05:21

So what do I think is gonna happen?

05:22

Well first of all, federal election is behind us, right?

05:25

So a lot of people will get back to, you know,

05:28

the new norm, if you will.

05:30

You know, people are putting stuff off

05:32

because they wanted to wait and see what was gonna happen.

05:34

I also think your market’s responding very well.

05:37

You know, interest rates are still really low,

05:38

I think the last two months of this year

05:40

are going to be substantially better than

05:41

the last two months of last year.

05:43

And right now, barring any crazy economic change,

05:46

say by the government, interests rates staying really low,

05:50

I think 2020 is looking very, very bright

05:53

for that Greater Vancouver Area.

05:55

So anyway, I hope this was helpful, everybody.

05:57

And at the end of the day, remember,

05:59

it’s a beautiful life, make it count.

Up next


Housing market ‘normalization’ continues in British Columbia

Thursday, November 14th, 2019

Signs point to market returning to normal conditions

Steve Randall
REP

The housing market in British Columbia has seen tough times since the introduction of the mortgage stress tests and other market-cooling measures.

But there are continued signs that the market is returning to more normal conditions according to stats from the British Columbia Real Estate Association.

Home sales in BC in October gained 19.3% year-over-year with a total of 7,666 residential unit sales were recorded by the MLS.

Meanwhile, prices were heading upwards with the average MLS® residential price in the province rising 5.1% year-over-year to $724,045, while total sales dollar volume was $5.55 billion, a 25.4% increase from the same month last year.

“Most markets around the province are returning to a more typical level of sales activity,” said BCREA Chief Economist Brendon Ogmundson. “That recovery in sales and slower listings activity is putting upward pressure on prices in many markets.”

Growth in active listings in the province was 1% year-over-year to 36,567 units, although down slightly when compared on a seasonally adjusted basis.

With sales and listings down, overall market conditions in the province have tightened, with a sales-to-active listings ratio of 21%.

Year-to-date sales data

Year-to-date, BC residential sales dollar volume was down 9% to $45.3 billion, compared with the same period in 2018. Residential unit sales were 6.2% lower at 65,468 units, while the average MLS® residential price was down 3% year-to-date at $691,618.

Copyright © 2019 Key Media Pty Ltd

Three Canadian cities among NA’s 10 most expensive retail streets

Thursday, November 14th, 2019

Vancouver?s Robson Street ranks 7th with rent for retail space

Steve Randall
Canadian Real Estate Wealth

With retailers under increasing pressure from online competitors, crippling rents are frequently a major cause of financial issues.

For retailers in Canada, operating from stores on the top shopping streets looks relatively affordable compared to some global peers; although three Canadian cities rank among North America’s most expensive.

The annual rankings of Main Streets Across the World from Cushman & Wakefield puts Hong Kong’s Causeway Bay firmly at the top of the most expensive.

The Chinese special region’s top retail street saw rents rise 2.30% in Q2 2019 to an eyewatering $2,745 per square foot, $500 dollars more than second-placed Upper 5th Avenue, New York.

London’s New Bond Street ($1,714 psf), Avenue des Champs-Élysées in Paris ($1,478), and Milan’s Via Montenapoleone ($1,447) complete the top 5.

Canadian cities do not rank in the top 20.

But when looking at the stats for North America, led by New York’s Upper 5th Avenue; Canada has three cities inside the top 10 most expensive.

Toronto’s Bloor Street is in 6th place – behind New York, San Francisco, Chicago, and Miami – at U$206 per square foot.

Vancouver’s Robson Street ranks 7th with rent for retail space of $153 psf; and Montreal’s Saint-Catherine West is 10th at $134 psf.

Canada also boasts the most affordable retail rent in North America though; Calgary’s 17th Avenue SW at $29 psf.

Copyright © 2019 Key Media Pty Ltd

Strata insurance coverage is limited to the cause

Thursday, November 14th, 2019

Limiting risk for one owner may raise it for others

Tony Gioventu
The Province

Dear Tony:

Our strata corporation renewed its insurance policy in October. Our deductible was increased from $25,000 to $100,000 and our policy has increased from $69,000 to $121,000. The increase will impose an eight-per-cent increase in our annual budget without any other increases, but we are most concerned by the deductible rate.

After investigating homeowner coverage, we have found most policies limit a claim amount for a deductible if the owner is responsible to a maximum of $50,000 or in rare cases, $75,000.

If an owner or their tenant is responsible for a claim, are we restricted to the limit of the amount an owner can cover in their policy?  

Our property manager has suggested a bylaw that limits an owner’s risk to $50,000, which would mean the remaining owners would cover the balance of the $100,000 deductible, or we would deplete our contingency funds to cover the cost.   

Because we averaged two claims a year over the past five years relating to water and careless owners, it is likely we will have at least one claim this year.

Would we be placing our owners in a position of greater risk by adopting this bylaw or is it a viable option for the strata corporation to consider?  

Marco D., Burnaby 

Dear Marco:

Insurance rates and deductible limits are rapidly rising across B.C. With a reduced number of companies providing insurance coverage and an increased rate of claims and risk, our brokers are struggling to obtain competitive coverage at manageable rates for the public.

The risk with multi-family buildings is the compounded damages that result from fire and water claims. When unit 401 experiences an overflowing bathtub, failed washing machine hose, burst water line on a refrigerator ice-maker or dishwasher line, or an aging piping system that fails, it is likely three or more units may be affected.

If the amount of a claim is below a deductible, each unit owner and the corporation bear the cost of their respective damages.That alone is a compelling argument for everyone to purchase homeowner insurance.

If the amount is above the deductible, the strata policy covers the claim to repair/replace the original fixtures and structure installed by the owner developer. If an owner is responsible for the claim, which does not necessarily require any neglect or wilful action, the strata may seek to recover the amount of the deductible from the owner. 

Limiting the risk of what an owner is responsible to cover may limit the risk for the claim, but it increases the risk to the remaining owners, which may not always be practical or fair. If an owner, their tenants or occupants cause a claim as a result of neglect or a willful act, why should the balance of the owners cover the cost?

A common example is damages caused by tenants who have been the cause of chronic problems in a building and the landlord is unwilling to evict the tenants, or an owner who has a hot water tank that is well past normal life expectancy and is refusing to upgrade. Why should a landlord or owner who has failed to address a problem or a risk be exempted from the higher deductible?  

If your strata corporation is considering a bylaw that limits the amount an owner may have to pay for a deductible, obtain legal advice from a lawyer experienced with strata law and insurance specifically for strata corporations. 

Certain conditions within the bylaws may ensure your strata corporation is not exposed to claims caused by neglect or wilful action or they could potentially limit your ability to recover the deductible. If there is a claim on the strata insurance resulting in a claim, the deductible is a common expense of the corporation.

There are several options to recover/pay the amount. If an owner is responsible for the claim, hopefully the owner has insurance and their insurance will voluntarily cover the deductible amount. However, if that is not the case, the strata corporation pays the claim and then commences a claim through the courts or the Civil Resolution Tribunal to obtain an order for the payment of the deductible amount.

If the owner is not responsible, the deductible is a common expense of the corporation and the strata corporation may pay the amount from the operating fund, the contingency reserve fund, or the strata council, without the need for a three-quarter vote at a general meeting, may set a special levy for the deductible and apply that as an assessment to all strata lots based on unit entitlement.  

As we approach deductible amounts of $50,000 $100,000 or $250,000, this is the most likely scenario. This may also allow owners with insurance that include this coverage to claim their share of the deductible on their policies. 

Remember, even though the special levy does not require a three-quarters vote, the council must still comply with the requirements of the act and show the total amount of the levy, how it is calculated and each unit share, the purpose of the levy, and the due date for the levy. 

© 2019 Postmedia Network Inc.

Password management startup wins $200 million investment to grow enterprise business

Thursday, November 14th, 2019

1Password now has ‘millions of users and over 50,000 companies’ on the service

James McLeod
The Vancouver Sun

Toronto-based 1Password announced Thursday that it has raised $200 million in venture capital — the first outside investment the startup has taken in its 14-year history — as it shifts from consumer markets into the rapidly growing enterprise segment.

1Password offers a password-management service which generates unique, complex passwords and stores them so that a user can easily log into various accounts.

The service is available for individuals and families, but 1Password chief executive Jeff Shiner said that in the past few years the real growth in the company has come from businesses adopting the service for their employees.

“We started off as a consumer app, but over the last five years we’ve spent a huge amount of time and effort to build out the sophisticated tools that businesses need for password managers — reporting, auditing, provisioning and advanced permissions,” Shiner said.

“Businesses now understand the need for enterprise password management. They understand that it’s a real challenge for their employees to try and follow crazy things like password rules, but at the same time they need to protect their IP.”

The company says that it currently has “millions of users and over 50,000 companies” on the service, and that the enterprise business has grown by more than 300 per cent in the past two years. 

The $200-million investment is the latest in a steady stream of massive venture capital raises for Canadian tech startups in the past year. Quebec-based Element AI announced a $150 million investment round in September, while a second artificial intelligence company in the province, Coveo, announced a $227 million investment round earlier this month.

Also in September, legal software startup Clio raised $250 million. 

But Shiner downplayed the importance of the money, saying that the advice and connections that investors can offer is more important.

“It’s actually having a partner who can bring us the experience, bringing us the relationships, bring us the knowledge,” he said. “It’s more than just the money itself.”

Shiner said that marketing 1Password to businesses instead of individuals means they need to develop different marketing tactics, and different sales channels.

“We really feel like everybody needs 1Password, but from a growth point of view, the B2B side, that’s where there’s a big opportunity, but that’s also where we need help going after that opportunity,” Shiner said.

Arun Mathew, a partner at Accel, the lead investor in 1Password, said that they believe there’s a huge opportunity, because business operations are becoming more and more dependent on cloud services.

“If you look at the rise of cloud-based services, especially in the enterprise, we believe that password management has become even more critical,” Mathew said. “Employees are using more products than ever before across a variety of different devices, and CISOs and IT teams aren’t able to oversee the use of all applications accessed across their enterprise.”

Mathew said he expects the funding to allow 1Password to sell to bigger enterprise customers.

“The enterprise password management category presents a massive opportunity, and this investment will enable the 1Password team to work with larger enterprises and to integrate more deeply into platforms their customers use daily.”

Within the technology sector, security is a major area of emphasis right now, with nearly every company playing up their diligence and competency at securing data against bad actors and hackers.

Shiner said he thinks that passwords remain a weak link for a lot of organizations.

“We talk to a lot of companies, obviously,” he said. “The one thing I’m still amazed by is how many of these companies are still doing things like using sticky notes, they’re still using spreadsheets to share passwords and remember passwords.”

© 2019 Financial Post, a division of Postmedia Network Inc.

It’s good news for the Vancouver real estate market

Thursday, November 14th, 2019

It’s good news for the Vancouver real estate market

Richard Robins
REM

VIDEO

Richard Robbins looks at the latest sales results for Greater Vancouver and has nothing but good news….well, almost. He takes a hard look at the October market and makes his predictions for 2020.

Surrey aims to share in any transit land lift values

Thursday, November 14th, 2019

While city staff completes zoning plan along SkyTrain extension, speculators are bidding up land prices

Frank O’Brien
Western Investor

A concept to ensure affordable housing along the new SkyTrain rapid transit extension in suburban Surrey has run into a major hurdle: spiralling residential land prices along the route.

The City of Surrey won’t have zoning and other planning complete for the 16.5-kilometre transit line until January 2020 and phase-one construction is not expected to start until 2021, but land speculators are already active along the transit corridor. The first phase of the SkyTrain will run from the existing King George Station in central Surrey to 168 Street, with the second phase continuing to Langley once funding is approved. 

An example of the land rush is a  bungalow on a quarter-acre lot close to the first transit station planned: it sold in September for $1.6 million. This price is twice the property’s assessed value of $839,300, and about $600,000 higher than the benchmark price of a Surrey detached house, as reported by the Fraser Valley Real Estate Board.

“A speculator-developer bought it,” confirmed real estate agent Joe Varing, head of Varing Marketing Group with HomeLife Glenayre Realty, who handled the transactions. The site, part of a planned land assembly, is now zoned for a floor-space ratio of 2.5, but the buyer is confident that zoning will be for high-density condominiums once the city’s transit corridor planning document is released, Varing said. 

Patrick Klassen, Surrey’s manager of community planning, however, warned developers that the city will be seeking a 50 per cent to 75 per cent share of any lift in land value related to transit corridor zoning. The final fees will not be decided until early next year, he said, after the land use plan is released.

The first public open house on the SkyTrain extension planning will be held mid-November at the Surrey Sports and Leisure Centre.

The only renderings outlining city plans for the area reveal a cluster of four-to 10-storey buildings with a mixture of retail and residential around the 152 Street station.  

Land along the proposed route is about the only residential property in Metro Vancouver that is selling far above assessed value. So far this year benchmark housing prices are down about 9 per cent from a year earlier, and most houses are selling for less than BC Assessment values set in July 2019, according to real estate sources.

Affordable housing is a goal, according to a City of Surrey statement released following approval of federal and provincial funding for the first phase of the transit extension, expected to cost $1.6 billion. 

“As part of the planning process [city] staff will integrate affordable housing strategy policies into measures that help preserve existing affordable housing, and particularly non-market rental housing within the plan areas in the corridor. As well, staff will develop location specific policies to provide incentives to encourage the development of affordable rental housing within the corridor,” the April 2018 city document reads.

If eventual city zoning does deter high-density market residential units along the SkyTrain corridor and takes a lion’s share of land lift values, it would not be the first disappointment for Surrey land speculators. 

Last year investors paid up to $4 million per acre for land along Surrey’s planned light-rapid transit line to Newton. That transit plan was scrapped, however, following the October 2018 civic election.

“I guess that is what can happen when we speculate,” Klassen said.

© Copyright 2019 Western Investor