Archive for February, 2010

The Erickson, named for legendary architect Arthur Erickson

Sunday, February 14th, 2010

A building with a towering twist

Province

The Erickson, named for legendary architect Arthur Erickson, is located at the westernmost point of the Concord Pacific property at False Creek, and is intended as the crowning point of that master-planned community. Members of the media were recently given a tour of The Erickson, a twisting 17-storey tower of metal, glass, and limestone that is anchored by a horizontal line of townhouses. The oblong blocks that cap the second storey and march around the perimeter are reminiscent of designs created by the world-renowned architect, including Simon Fraser University and the Law Courts at Robson Square. All the suites were sold more than three years ago, except for the penthouse, a 10,000-square-foot unit has a private pool, lobby, and two-car garage.

© Copyright (c) The Province

Some types of corner-cutting open doors to conflict

Sunday, February 14th, 2010

Tony Gioventu
Province

Dear Condo Smarts: Our strata had a flood before the holidays where an overloaded washing machine went manic and soaked three units in our building. The council was contacted; it made arrangements for restoration and we had fans in hallways and holes cut in the walls for dryers. The owners were impressed that it happened so quickly.

As for the owner with the manic washing machine, she just received a bill for the deductible amount of $5,000. She was about to pay it, but noticed the bill was not from the insurance company, so called the insurer to see the insurance invoice. Council refused to file the claim and we’ve now found out the council hired themselves to do the restoration work and bill it back to the owner.

There was no adjuster involved, and no report on the scope of the work done, or if even all the restoration was complete. One owner is still left with a wet, stained ceiling and no one coming to her aid. Is it a conflict of interest when council members pay themselves?

— Liz W, Richmond

Dear Liz: Conflict of interest is a common bone of contention in strata corporations when the council executes decisions that result in personal benefits without the consent of the strata owners or exempting the benefited strata council member. The Strata Property Act says in part: “A council member who has a direct or indirect interest in a contract or transaction with the strata or decision that is a subject being addressed by the strata … must 1) disclose fully and promptly to the council the nature and extent of the interest 2) abstain from voting on the transaction or matter, and 3) leave the council meeting with the contract, transaction or matter is discussed and while the remaining council votes on the contract, transaction or matter.”

Here are the basics. Strata council must act in the best interest of the strata corporation; they cannot be compensated for their duties as council members without the approval of the corporation, either in the budget, in the bylaws or by approved 3/4 vote at a general meeting; and a council member cannot vote on the awarding of a contract, transaction, or matter where he or she has some sort of direct or indirect personal or beneficial gain. Strata council can determine who it contracts with, and that could include a council member, but is that person qualified? Would it be a prudent decision to contract with a council member who may not be qualified, covered by WCB, insured or even competent to perform the work? Were the repairs and restoration completed properly?

In addition, the owner affected by the alleged deductible claim likely also now has a problem with her own insurance company’s willingness to cover the deductible claim, as it is not a deductible, but an invoice from the strata corporation of a related repair. Council members who try to cut corners on the cost of claims or who attempt to compensate each other for any of the strata council duties without the strata approval are just opening the door for conflicts.

Tony Gioventu is executive-director of the Condominium Home Owners’ Association. Send questions to him at [email protected]

Note: The Spring list of Seminars across B.C. is now posted on the CHOA website. Public seminars are ideal for strata owners, councils and managers. Space is limited. Visit www.choa.bc.ca for more information.

© Copyright (c) The Province

Buying a property in Canada?

Sunday, February 14th, 2010

Other

We have access to mortgage products designed for qualified homebuyers who have immigrated to Canada, are relocating to Canada by an employer, or an offshore citizen that would like to invest in the Canadian market.

Non-Residents Buying in Canada

There are many lenders that provide mortgages to non-residents whether you are buying a vacation property or purchasing a property for investment.

Non-residents buying in Canada are eligible if the applicant is:

  • Considered an acceptable credit risk
  • Has a bankers recommendation from country of origin or
  • Has confirmation of income (2 years of tax returns)
  • Proof of down payment  (35% down)

Immigrating to Canada

Now qualified homebuyers who have immigrated or relocated to Canada can qualify for a mortgage for as little as 10% down.

  • Have recently immigrated or relocated to Canada within the last 24 months
  • Show a minimum of 3 months full time employment in Canada (borrowers being transferred through a corporate relocation program are exempt from this requirement)
  • Must have a valid work visa or obtain landed immigrant status
  • Must have full disclosure of all financial obligations
  • Letter of reference from a recognized financial institution and or an international credit report demonstrating a strong credit profile
  • Proof of down payment

VWWFC   Alma Pasic  604 729 4611 [email protected]    www.almapasic.com

Time at Walnut Grove

Saturday, February 13th, 2010

Langley townhouse’s details, large and small, impress Shannon Johnston

Mary Frances Hill
Sun

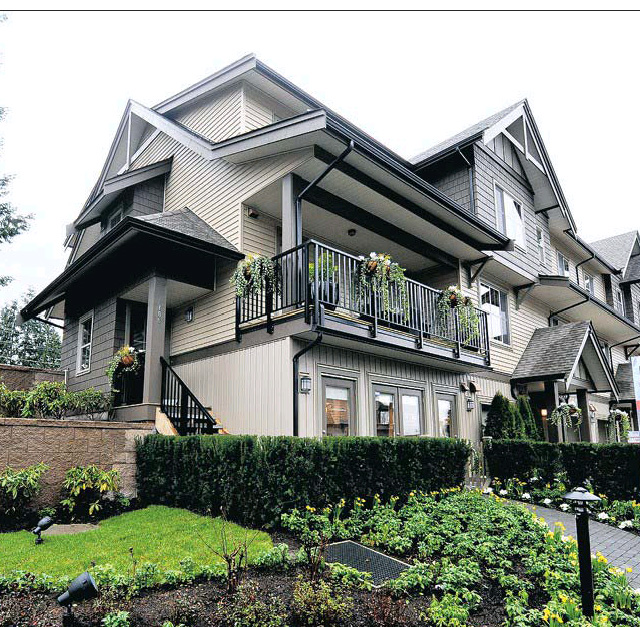
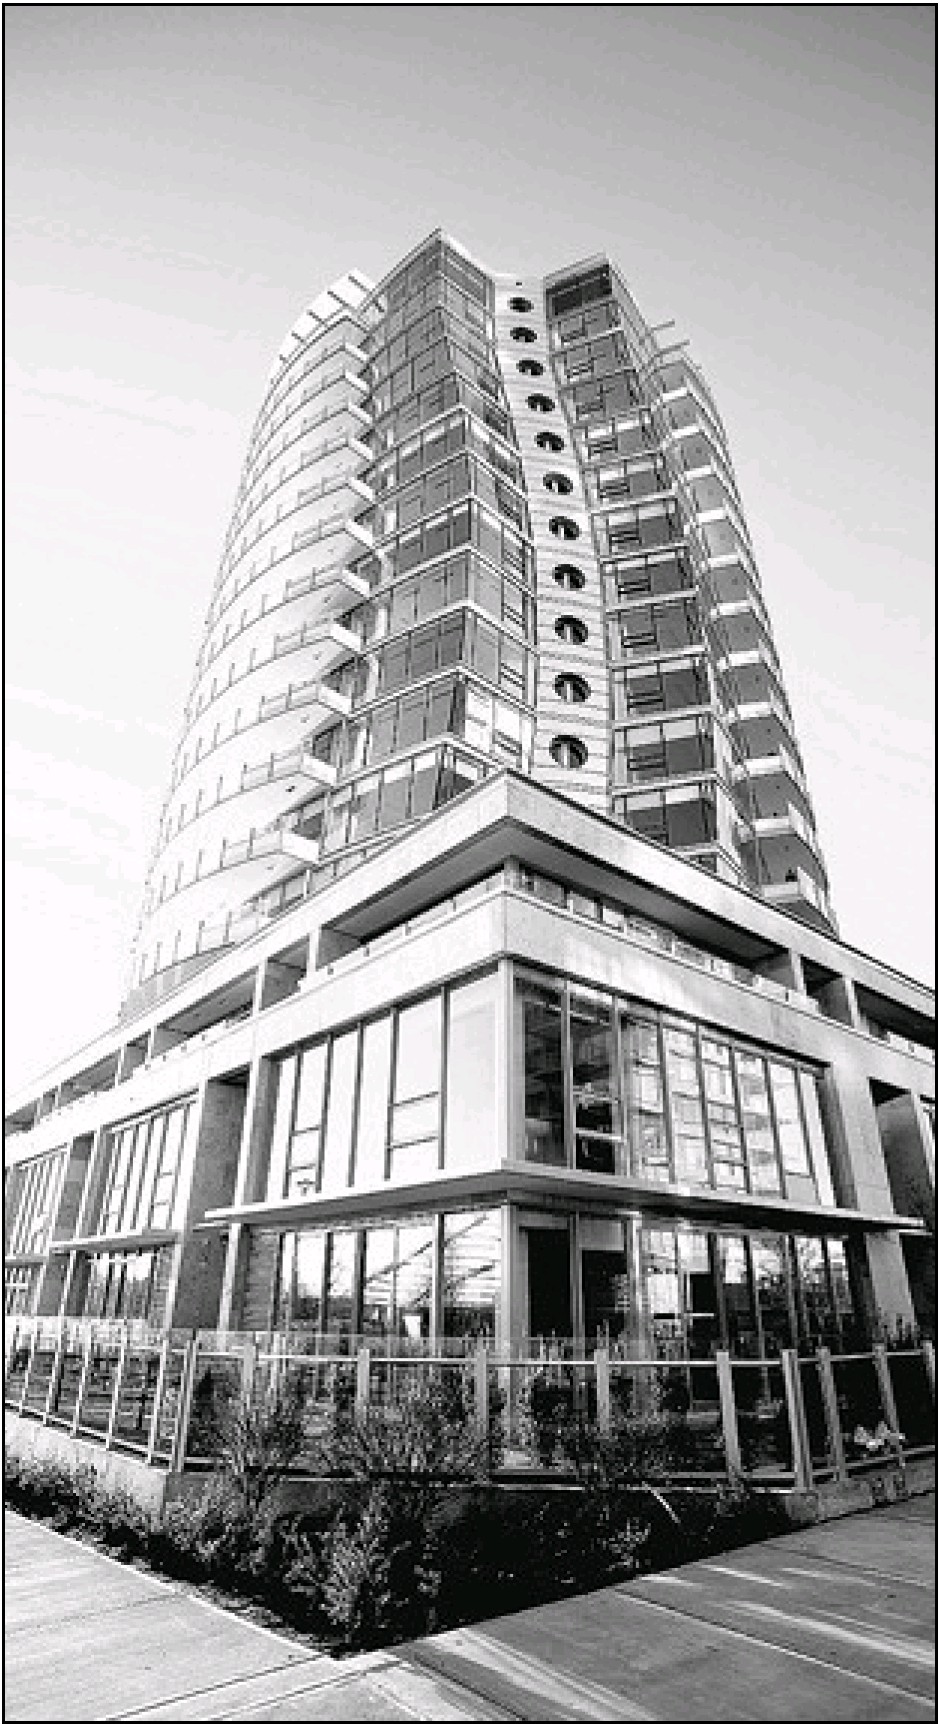
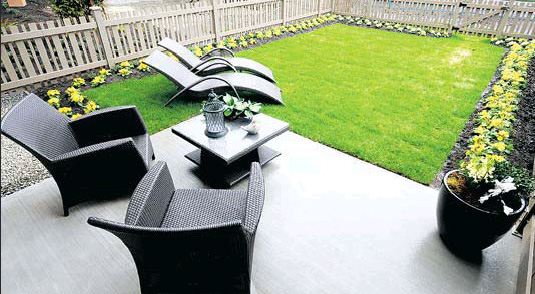
The Time at walnut Grove homes reflect Craftsman-style architecture, with stone and wood shingle accents. Each comes with a fenced back yard, and a private deck or patio. Some will have front porch entrances. Floors in the main living area will be topped with laminate hardwoods.

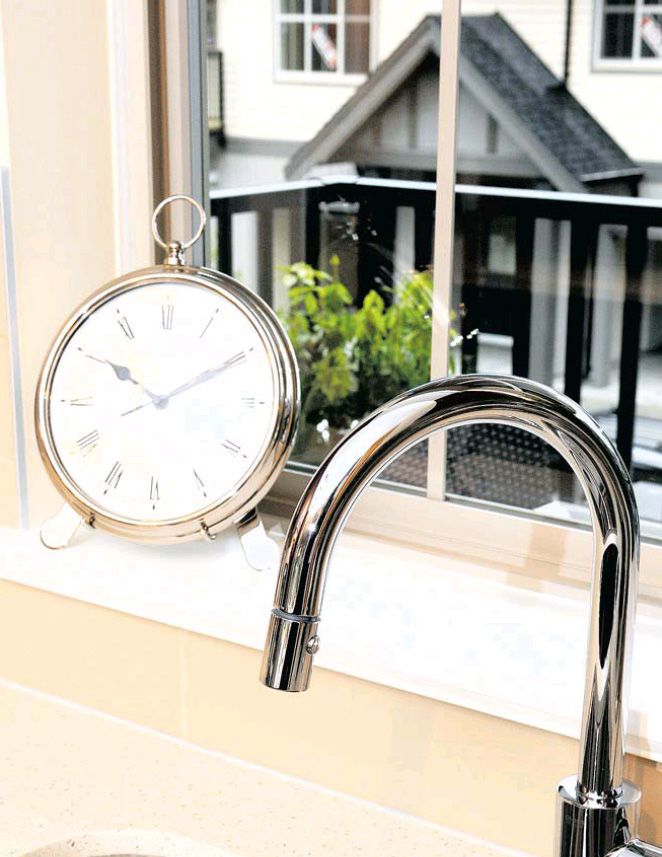
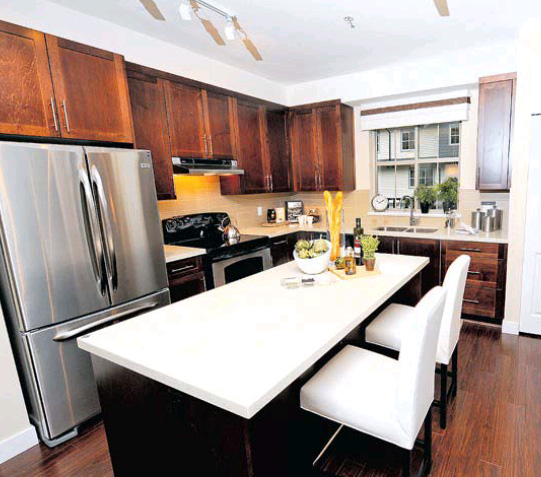
ParkLane project sales manager Jenny Wun says each of the homes at Time at Walnut Creek has different characteristics. A buyer’s choice, she says, will be determined by family size, and by the lifestyle of that family. Open-plan kitchens will have generous islands and plenty of room for storage and prep work. Buyers will be able to choose from two styles of kitchen finishings: morning or evening. Photograph by: Photos By Glenn Baglo, Special To The Sun Png

Time at Walnut Grove

Location: Langley

Project size: 106 townhouses Residence size: 1,300 sq. ft. — 1,788 sq. ft., 3 bed– 3 bed +rec room Prices: From low $300,000s Developer: ParkLane Homes Architect: Burrowes Huggins Interiors: The Creative DesignWorks, Inc., After Design/Tanya Schoenroth Design

Sales centre: 9525 204th Street, Langley

Hours: noon to 5 p.m. daily Telephone: 604 694-1819 Yosh Kasahara, marketing manager, 604-648-1839 Web: timeatwalnutgrove.com

Occupancy: From April

Not long ago, Shannon Johnston introduced three of her relatives to the new townhouse she and husband Craig will be moving into in April — and she couldn’t stop smiling.

“Every time I come here I see and learn something new and different, that I haven’t seen before,” said Shannon of the home, measuring about 1,300 square feet, at Time at Walnut Grove. The 106-townhouse Langley development, a product of ParkLane Homes, in now its final phase of construction.

For the young couple, Time was the perfect fit.

Shannon‘s brother and sister-in-law live a few blocks away, and her childhood home is within walking distance of the development.

“I grew up in my parents’ house just down the street and I don’t want to leave this community,” she says. “I do coffee with my dad every morning and my husband watches every hockey game with him at night. We’re very tight.

“We looked at several other developments, but none of them were walking distance from family, and that’s really important to us.”

The main show home displays the developer’s most spacious layout, at 1,788 square feet, which ParkLane project sales manager Jenny Wun believes will be particularly attractive to families.

Each home comes with a standard fenced front or backyard and at least one balcony.

Owners can choose between berber and nylon carpets, and from two styles of kitchen finishings. The most spacious plan — a 1,788-square-foot until with three bedrooms and a recreation room — will cost owners below $500,000, even when fitted with the higher-end kitchen and flooring options. As well, all homes come with a 2-5-10 homeowners warranty.

The largest homes include a storage or work space a step away from the kitchen, which flows into a powder room at one side and a balcony at the other.

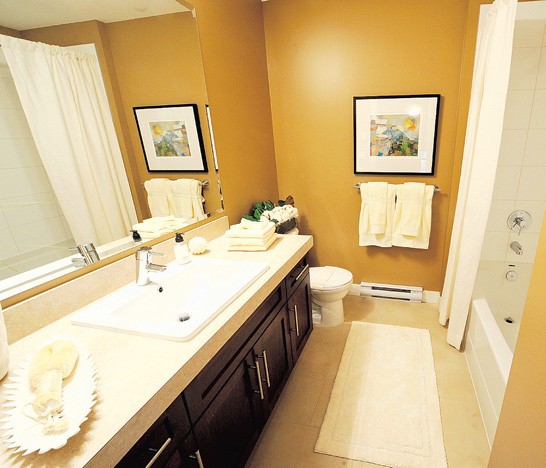
Ceilings on the main and upper floors rise to are nine feet. Master bathrooms include soaker tubs, Grohe fixtures and square his-and-her sinks.

“Every home has its different characteristics,” says Wun. “So [buyers’ choices] depend on how big the family is, and their lifestyle.”

ParkLane has contributed to the building and maintenance of walkways that connect to a municipal park space that borders on the Time property.

At least 18 homes will back onto the park and its series of bike trails that link to routes established by the township of Langley.

Wun says the homes have attracted their share of empty nesters, but a glimpse at Time’s website suggests the developer is also appealing to the younger crowd. (The site notes nearby schools, for instance.)

Craig and Shannon, who now live in Shannon’s father’s basement suite, are looking forward to playing host. Shannon’s an enthusiastic cook, and that passion was reflected in her choice of layout.

“We liked the open-plan layout with the big kitchen,” she says.

The plan they chose includes an Lshaped kitchen. The home includes a “flex” space between the dining room area and the living room.

Wun says it was important to add extra space to give homeowners the option of expanding either their dining or relaxing space. The couple warmed to that option.

“We wanted to move somewhere where we could have space to re-arrange furniture,” Shannon says. “So many other developments we have seen are designed in a way where you have to have your furniture in a certain spot.”

“But there’s enough room for us to extend our living room if we want.”

For now, Shannon has eyes only for the details, the otherwise small things she predicts will make her life that much easier.

She says that everything from the electrical outlets in the kitchen island — “handy when I do my cooking prep work” — to the rainfall shower head and the contemporary double sinks in the master bathroom is heightening her anticipation.

For the couple, the move may be a signal of a promising start, but it’s not exactly a launch pad for the young couple.

They’re keen to stay put.

“This isn’t a starter home,” says Shannon Johnston.

“It’s a ‘home home.’ “

© Copyright (c) The Vancouver Sun

Home sales 27% higher in 4th quarter over last year

Friday, February 12th, 2010

Stephanie Armour
USA Today

The median sales price for previously-owned homes rose in 67 out of 151 metropolitan areas in the fourth quarter of 2009. By Nati Harnik, AP

Home sales posted strong gains in the fourth quarter and prices rose in nearly 45% of U.S. metropolitan areas compared with a year earlier, more evidence of an improving climate in housing.

Bolstered by low interest rates and a first-time home buyers tax credit, existing-home sales rocketed 27.2% from the fourth quarter of 2008 to a seasonally adjusted annual rate of 6.03 million, the National Association of Realtors reported Thursday.

The national median price for an existing single-family home was $172,900, or 4.1% below the median price in fourth-quarter 2008. That was the smallest price decline in more than two years.

BUT …January foreclosures up 15% from year ago; surge on way?

Prices rose in 67 out of 151 metro areas in the fourth quarter compared with a year earlier. Only 30 areas had annual price increases in the third quarter.

Sixteen areas had double-digit increases last quarter, led by Saginaw, Mich., up 53.5% to a median of $67,400.

“There’s a growing body of evidence that the housing market has stabilized. The question is how quickly can it recover and will we bump along at the bottom for a couple of months?” says Bernard Baumohl, chief global economist at the Economic Outlook Group. “In the first couple of months of 2010, we should see a healthy turnaround.”

Baumohl says the combination of low interest rates and tax credits for qualifying home buyers should lure buyers, further stabilizing prices and boosting sales.

But the market could falter once the tax credit expires April 30 and if interest rates begin to climb later this year as many economists expect.

The credit is worth up to $8,000 for first-time buyers and up to $6,500 for repeat buyers. But they must have purchase contracts signed by April 30 and close by June 30.

The national average mortgage rate for a 30-year, fixed-rate loan fell to 4.97% this week, down from 5.01% a week ago, Freddie Mac reported Thursday.

But foreclosures are expected to climb, which could further depress prices. Foreclosure filings were reported on 315,716 properties in January, 15% more than a year ago, RealtyTrac reported Thursday.

“It’s premature to say the coast is clear. The housing credit really played a role in juicing up sales,” says Mark Zandi at Moody’s Economy.com. “We’re closer to the end of the downturn than the beginning, but we’re not there yet.”

Median home prices of existing single family home by metro area
Not seasonally adjusted; prices in the thousands


Metropolitan Area


2007


2008.IV


2009.IV*


%Change

Akron, OH

$119.3

$86.1

$105.7

22.8%

Albany-Schenectady-Troy, NY

$198.9

$193.1

$182.7

-5.4%

Albuquerque, NM

$198.5

$183.7

$175.6

-4.4%

Allentown-Bethlehem-Easton, PA-NJ

$260.8

$238.0

$215.1

-9.6%

Amarillo, TX

$118.4

$122.6

$122.2

-0.3%

Anaheim-Santa Ana, CA (Orange Co.)

$709.5

$464.8

$495.0

6.5%

Appleton, WI

$130.0

$127.6

$0.0

0.0%

Atlanta-Sandy Springs-Marietta, GA

$172.0

$129.2

$124.8

-3.4%

Atlantic City, NJ

$269.7

$229.1

$222.7

-2.8%

Austin-Round Rock, TX

$183.7

$184.8

$184.0

-0.4%

Baltimore-Towson, MD

$286.1

$260.1

$243.9

-6.2%

Barnstable Town, MA

$384.7

$325.5

$337.7

3.7%

Baton Rouge, LA

$174.4

$156.4

$157.4

0.6%

Beaumont-Port Arthur, TX

$123.0

$132.6

$126.1

-4.9%

Binghamton, NY

$111.2

$105.8

$117.9

11.4%

Birmingham-Hoover, AL

$161.3

$135.4

$144.3

6.6%

Bismarck, ND

$152.9

$164.5

$157.0

-4.6%

Bloomington-Normal, IL

$154.0

$159.3

$146.7

-7.9%

Boise City-Nampa, ID

$206.0

$168.8

$144.3

-14.5%

Boston-Cambridge-Quincy, MA-NH**

$395.6

$336.0

$332.8

-1.0%

Boulder, CO

$376.2

$324.7

$335.1

3.2%

Bridgeport-Stamford-Norwalk, CT

$486.6

$380.6

$373.7

-1.8%

Buffalo-Niagara Falls, NY

$104.0

$106.2

$110.7

4.2%

Canton-Massillon, OH

$110.3

$80.4

$87.6

9.0%

Cape Coral-Fort Myers, FL

$252.1

$110.9

$90.1

-18.8%

Cedar Rapids, IA

$136.2

$136.9

$139.4

1.8%

Champaign-Urbana, IL

$144.1

$132.0

$139.5

5.7%

Charleston-North Charleston, SC

$215.4

$193.8

$187.0

-3.5%

Charleston, WV

$122.5

$124.7

$123.2

-1.2%

Charlotte-Gastonia-Concord, NC-SC

$204.3

$186.3

$185.5

-0.4%

Chattanooga, TN-GA

$130.9

$123.8

$120.7

-2.5%

Chicago-Naperville-Joliet, IL

$276.6

$217.8

$191.5

-12.1%

Cincinnati-Middletown, OH-KY-IN

$140.8

$116.0

$125.0

7.8%

Cleveland-Elyria-Mentor, OH

$130.0

$88.3

$110.1

24.7%

Colordo Springs, CO

$217.5

$187.0

$189.8

1.5%

Columbia, MO

$147.1

$138.1

$143.9

4.2%

Columbia, SC

$146.6

$139.2

$0.0

0.0%

Columbus, OH

$147.4

$126.5

$132.5

4.7%

Corpus Christi, TX

$136.5

$134.0

$136.8

2.1%

Cumberland, MD-WV

$109.4

$96.9

$109.9

13.4%

Dallas-Fort Worth-Arlington, TX

$150.9

$138.0

$142.1

3.0%

Davenport-Moline-Rock Island, IA-IL

$108.7

$98.1

$106.7

8.8%

Dayton, OH

$115.6

$87.8

$106.4

21.2%

Decatur, IL

$83.1

$79.3

$84.5

6.6%

Deltona-Daytona Beach-Ormond Beach, FL

$192.3

$143.6

$122.6

-14.6%

Denver-Aurora, CO

$245.4

$200.8

$223.2

11.2%

Des Moines, IA

$149.2

$149.7

$143.4

-4.2%

Dover, DE

$207.5

$212.4

$195.3

-8.1%

Durham, NC

$178.4

$165.6

$166.4

0.5%

Elmira, NY

$81.6

$80.9

$86.8

7.3%

El Paso, TX

$131.9

$140.7

$133.0

-5.5%

Erie, PA

$98.1

$95.2

$97.7

2.6%

Eugene-Springfield, OR

$239.6

$212.8

$198.1

-6.9%

Fargo, ND-MN

$140.9

$140.1

$139.8

-0.2%

Farmington, NM

$191.1

$184.9

$184.3

-0.3%

Florence, SC

$124.2

$119.1

$118.8

-0.3%

Ft. Wayne, IN

$97.1

$88.6

$93.5

5.5%

Gainesville, FL

$211.1

$174.0

$165.8

-4.7%

Gary-Hammond, IN

$134.2

$115.1

$124.5

8.2%

Glens Falls, NY

$167.6

$147.6

$154.5

4.7%

Grand Rapids, MI

$129.4

$80.5

$89.9

11.7%

Green Bay, WI

$150.7

$146.6

$131.6

-10.2%

Greensboro-High Point, NC

$152.0

$135.4

$127.9

-5.5%

Greenville, SC

$153.6

$146.9

$137.8

-6.2%

Gulfport-Biloxi, MS

$154.5

$129.5

$128.2

-1.0%

Hagerstown-Martinsburg, MD-WV

$208.5

$171.4

$152.1

-11.3%

Hartford-West Hartford-East Hartford, CT

$263.2

$233.7

$226.6

-3.0%

Honolulu, HI

$643.5

$610.0

$612.3

0.4%

Houston-Baytown-Sugar Land, TX

$152.5

$142.1

$150.0

5.6%

Indianapolis, IN

$120.5

$100.2

$111.5

11.3%

Jackson, MS

$139.0

$126.6

$131.9

4.2%

Jacksonville, FL

$189.2

$160.7

$141.3

-12.1%

Kankakee-Bradley, IL

$134.5

$125.6

$127.9

1.8%

Kansas City, MO-KS

$153.3

$131.0

$139.5

6.5%

Kennewick-Richland-Pasco, WA

$169.2

$165.9

$168.1

1.3%

Kingston, NY

$258.4

$224.0

$215.4

-3.8%

Knoxville, TN

$156.4

$141.7

$139.3

-1.7%

Lansing-E.Lansing, MI

$126.8

$80.0

$83.9

4.9%

Las Vegas-Paradise, NV

$297.7

$181.7

$139.4

-23.3%

Lexington-Fayette,KY

$147.5

$138.2

$140.7

1.8%

Lincoln, NE

$137.5

$133.1

$130.5

-2.0%

Little Rock-N. Little Rock, AR

$129.1

$125.2

$132.4

5.8%

Los Angeles-Long Beach-Santa Ana, CA

$593.6

$354.3

$352.7

-0.5%

Louisville, KY-IN

$137.4

$124.0

$130.1

4.9%

Madison, WI

$226.5

$227.0

$204.3

-10.0%

Manchester-Nashua, NH

$0.0

$238.6

$225.2

-5.6%

Memphis, TN-MS-AR

$137.2

$100.2

$120.8

20.6%

Miami-Fort Lauderdale-Miami Beach, FL

$365.5

$234.2

$199.3

-14.9%

Milwaukee-Waukesha-West Allis, WI

$223.4

$194.9

$188.4

-3.3%

Minneapolis-St. Paul-Bloomington, MN-WI

$225.2

$174.0

$167.5

-3.7%

Mobile, AL

$136.4

$125.0

$125.5

0.4%

Montgomery, AL

$143.8

$126.3

$126.2

-0.1%

New Haven-Milford, CT

$286.5

$240.4

$237.1

-1.4%

New Orleans-Metairie-Kenner, LA

$160.3

$154.9

$157.9

1.9%

New York-Northern New Jersey-Long Island, NY-NJ-PA

$469.7

$391.4

$375.9

-4.0%

New York-Wayne-White Plains, NY-NJ

$540.3

$459.2

$434.0

-5.5%

NY: Edison, NJ

$380.3

$344.0

$327.9

-4.7%

NY: Nassau-Suffolk, NY

$477.2

$382.1

$383.2

0.3%

NY: Newark-Union, NJ-PA

$443.7

$374.4

$341.5

-8.8%

Norwich-New London, CT

$267.7

$223.1

$208.6

-6.5%

Ocala, FL

$164.6

$121.7

$93.2

-23.4%

Oklahoma City, OK

$134.9

$124.2

$136.3

9.7%

Omaha, NE-IA

$138.0

$129.7

$130.4

0.5%

Orlando, FL

$261.3

$175.2

$139.6

-20.3%

Palm Bay-Melbourne-Titusville, FL

$183.6

$123.6

$100.2

-18.9%

Pensacola-Ferry Pass-Brent, FL

$165.6

$151.7

$142.5

-6.1%

Peoria, IL

$118.6

$117.2

$111.9

-4.5%

Philadelphia-Camden-Wilmington, PA-NJ-DE-MD

$234.9

$212.5

$212.6

0.0%

Phoenix-Mesa-Scottsdale, AZ

$257.4

$155.9

$143.9

-7.7%

Pittsburgh, PA

$120.7

$109.1

$114.3

4.8%

Pittsfield, MA

$217.4

$206.0

$173.1

-16.0%

Portland-South Portland-Biddeford, ME

$242.7

$214.5

$205.9

-4.0%

Portland-Vancouver-Beaverton, OR-WA

$295.2

$264.5

$239.4

-9.5%

Providence-New Bedford-Fall River, RI-MA

$286.5

$224.5

$220.4

-1.8%

Raleigh-Cary, NC

$224.2

$230.9

$219.5

-4.9%

Reading, PA

$154.7

$155.1

$152.8

-1.5%

Reno-Sparks, NV

$321.4

$231.2

$187.4

-18.9%

Richmond, VA

$233.7

$199.4

$0.0

0.0%

Riverside-San Bernardino-Ontario, CA

$379.5

$201.3

$176.8

-12.2%

Rochester, NY

$117.9

$112.5

$112.1

-0.4%

Rockford, IL

$119.3

$111.5

$108.3

-2.9%

Sacramento–Arden-Arcade–Roseville, CA

$342.8

$187.9

$188.6

0.4%

Saginaw-Saginaw Township North, MI

$82.1

$43.9

$67.4

53.5%

Saint Louis, MO-IL

$145.4

$113.7

$126.8

11.5%

Salem, OR

$228.3

$198.0

$176.7

-10.8%

Salt Lake City, UT

$232.0

$225.4

$207.8

-7.8%

San Antonio, TX

$153.2

$143.4

$143.8

0.3%

San Diego-Carlsbad-San Marcos, CA

$588.7

$353.4

$379.2

7.3%

San Francisco-Oakland-Fremont, CA

$804.8

$487.1

$551.3

13.2%

San Jose-Sunnyvale-Santa Clara, CA

$836.8

$525.0

$585.0

11.4%

Sarasota-Bradenton-Venice, FL

$310.9

$178.1

$171.3

-3.8%

Seattle-Tacoma-Bellevue, WA

$386.9

$325.9

$305.5

-6.3%

Shreveport-Bossier City, LA

$135.6

$139.2

$149.3

7.3%

Sioux Falls, SD

$144.5

$142.4

$137.0

-3.8%

South Bend-Mishawaka, IN

$90.7

$80.8

$88.4

9.4%

Spartanburg, SC

$128.6

$120.8

$121.2

0.3%

Spokane, WA

$193.8

$185.9

$170.1

-8.5%

Springfield, IL

$109.0

$96.7

$111.8

15.6%

Springfield, MA

$211.9

$186.4

$182.8

-1.9%

Springfield, MO

$122.6

$117.1

$109.9

-6.1%

Syracuse, NY

$121.8

$114.1

$115.9

1.6%

Tallahassee, FL

$179.5

$150.1

$151.8

1.1%

Tampa-St.Petersburg-Clearwater, FL

$214.9

$151.5

$140.2

-7.5%

Toledo, OH

$106.6

$75.6

$86.5

14.4%

Topeka, KS

$111.9

$104.8

$102.0

-2.7%

Trenton-Ewing, NJ

$307.1

$247.8

$246.9

-0.4%

Tucson, AZ

$244.8

$185.9

$166.7

-10.3%

Tulsa, OK

$0.0

$0.0

$128.1

0.0%

Virginia Beach-Norfolk-Newport News, VA-NC

$226.8

$210.0

$200.0

-4.8%

Washington-Arlington-Alexandria, DC-VA-MD-WV

$430.8

$295.1

$306.2

3.8%

Waterloo/Cedar Falls, IA

$112.8

$105.2

$113.7

8.1%

Wichita, KS

$115.6

$118.2

$115.2

-2.5%

Worcester, MA

$274.6

$217.0

$221.9

2.3%

Yakima, WA

$156.5

$145.9

$149.9

2.7%

Youngstown-Warren-Boardman, OH-PA

$78.9

$61.7

$72.7

17.8%


* — preliminary
Source: National Association of Realtors

Erickson’s twisted tower on False Creek awaits its inaugural households

Friday, February 12th, 2010

Concord Pacific is a stunning punctuation point for the new False Creek North community

Claudia Kwan
Sun

The Erickson, named for legendary architect Arthur Erickson, is intended as the crowning point in the Concord Pacific neighbourhood beside False Creek. Interior design work was done by the noted Robert Ledingham.

It’s named after Arthur Erickson, a pioneer at incorporating natural geography into a building, so a tour of The Erickson can begin only by explaining where it is located.

The development is perched just behind the seawall as the pedestrian and bike path winds by a small point jutting out into False Creek. It is the furthest possible westernmost point on the Concord Pacific property.

“Over there is a building by Barry Downs, another by Richard Henriquez,” says Peter Webb. “Jim (James) Cheng did that one over there.” The senior vice-president of developer Concord Pacific is pointing to buildings within a stone’s throw of The Erickson, noting other local architects who had a hand in the look of the master-planned parcel of lands once known as the Expo lands.

But it is The Erickson that is intended to be the crowning point of the community. The world-renowned architect worked on the building with Milkovich Architects in the early 2000s, and had extensive input in the interior design done by Robert Ledingham. Erickson even showed up at a cocktail party or two thrown by the marketing department for buyers of the luxury suites, charming the guests, says Webb.

The twisting tower of metal, glass, and limestone is anchored by a horizontal line of townhouses. The oblong blocks that cap the second storey and march around the perimeter are reminiscent of landmark Erickson designs such as Simon Fraser University and the Law Courts at Robson Square.

Conceived as a punctuation point to the Concord Pacific site, The Erikson’s design esthetic was summed up as a twisted lighthouse. Erickson was renowned for having a specific vision for individual sites; it seems in the years before his death in 2009, he begrudgingly bowed to external design constraints.

“Arthur said ‘the tower wants to be tall,’ ” recalls Webb. Erickson originally wanted it to be 25 storeys, and to visually extend all the way to the ground, rather than be partially obscured by the town houses.

“The city wasn’t on board with that and, in the meantime, other Concord buildings had gone up; there were some concerns about affecting the views,” Webb says. Erickson gave way on the tower -it is 17 storeys, with a base tucked inside a courtyard formed by the town houses. He did, however, get his way with the town houses, restricting their height to two storeys.

The 11 2,500-square-foot town houses have through-views, where people standing in the courtyard can see beyond to the water on the other side of the home. The cantilevered roofs are green, planted with hardy grasses, instead of used as roof decks.

The interiors of the 61 suites in the tower are in a word, spectacular. (At an average price of more than $3 million, many would say they should be.) The twisting of the tower means each has a unique view, including one from a porthole-like half moon-shaped window in the master bathroom.

The bathroom is also where you find an under-lit counter of golden onyx, a TV in the mirror, and an elongated oval Lavasca bathtub. Made from solid resin, the bathtubs had to be brought into place by crane while the building was under construction.

Webb points out the small details that speak to the design esthetic: flush baseboards, drains inset into the floor for a seamless look, and wooden door frames that extend to the ceiling. Every suite has a two-car garage and private elevator access; Webb says the idea is that penthouse-style living for everyone.

A 20-foot window wall in the central living area allows an easy transition from the indoors to an expansive balcony, which highlights 270-degree views. However, if you’re dreaming of having a piece of the Erickson, you may be out of luck.

All the suites were sold more than three years ago, except for the actual penthouse. The 10,000-square-foot unit has a private pool, lobby, and two-car garage. Webb won’t say yet what the price tag is.

Broadcaster and reporter Claudia Kwan is a regular contributor to At Home. She reads correspondence at twitter.com/thatclaudiakwan.

© Copyright (c) The Vancouver Sun

B.C. home sales remain high, less frenetic

Friday, February 12th, 2010

Markets are easing to levels in keeping with the economy

Derrick Penner
Sun

TANNEN MAURY/ BLOOMBERG NEWS FILES

Real estate sales in January eased off the frenetic pace markets saw in December across British Columbia, the B.C. Real Estate Association reported Thursday.

While overall provincial market in January represented a sea change from the doldrums of early 2009, buyers seem to be coming sated.

“We saw a dramatic rebound in sales since last January, and that pace of sales that we saw in December, and during the last quarter, was unlikely to be sustained through 2010,” Cameron Muir, the association’s chief economist said in an interview.

January’s sales, recorded through the Multiple Listing Service, hit 4,619 units, some 118 per cent more than the same month a year ago, but down about 16 per cent from December.

That slowing from December’s hectic pace, Muir said, happened because many home hunters have bought, which lessens the “pent up demand.” Other potential buyers, however, have been squeezed out by the rebound in home prices, which have begun to again approach pre-downturn highs.

With sales still elevated, the provincial average price hit $491,571 in January, up 19 per cent from the same month a year ago.

“Mortgage rates are still low,” Muir said, so on the basis of monthly payments, “housing is still more affordable than it was at the previous peak in the first quarter of 2008.”

However, with less pent-up demand and with home sellers expected to list homes in larger numbers during the coming months, Muir said “we are likely to see much less upward pressure” on prices during the rest of the year.

Carol Frketich, regional economist for Canada Mortgage and Housing Corp., said January’s easing in sales compared with December “is right in line with CMHC’s forecast.”

The high level of sales through the end of 2009, which was driven largely by the rapid decline of mortgage rates to record low levels that made monthly home payments more affordable, were expected to cool as conditions changed.

“What we’re seeing now is sales moving lower from high levels back to levels that are more consistent with economic fundamentals,” said Frketich, with those economic conditions being a slow recovery from the recession of late 2008 and early 2009.

While unemployment is still higher than it was at the peak, Frketich said the employment market is a “lagging indicator” of economic improvement. Companies do not start hiring again until they are sure business is improving.

And Frketich said other economic conditions, such as retail sales, have shown that the economy is beginning to improve.

Meanwhile, the higher levels of home sales have prompted developers to start work on more new homes, and builders are being rewarded with slight rises in prices.

Statistics Canada released its survey on new home prices Thursday, which showed that Metro Vancouver’s new home prices in December increased 0.7 per cent from November. However, prices had still not caught up with where they were in December 2008, remaining 2.2 per cent below that mark.

Nationally, new-home prices were up 0.4 per cent in December compared with November

© Copyright (c) The Vancouver Sun

Property tax deferral plan just puts off painful day of reckoning

Friday, February 12th, 2010

Young families need tax cuts. Pay-me-later scheme doesn’t make home ownership more affordable — it just creates that illusion

Craig McInnes
Sun

Scott Hannah sees a lot of young families that are having trouble paying their bills.

He is the president and CEO of the Credit Counselling Society, a non-profit organization that helps people who are drowning in debt.

Last year, they fielded 40,000 calls for assistance and signed up 9,000 new clients in British Columbia. So he is always looking for anything that offers relief for people who have waded in over their heads.

Naturally, Hannah listened with interest when the provincial government announced in the speech from the throne earlier this week that it was preparing a new lifeline for young families.

But from what he’s seen so far, he’s not impressed with a new program that would let parents with children 18 and under defer payment of their municipal property taxes.

While there are no details, the Family with Children Property Tax Deferral Option is described as being similar to the one already available for seniors.

It allows them to put off paying property taxes until their home is sold, while paying below market rates on the unpaid balance.

For seniors who have little income and who live in homes that have increased in value, it can be a useful option for allowing them to stay put.

But what makes sense for seniors does not translate well into meeting the needs of young families.

Deferring property taxes doesn’t make home ownership more affordable, even though it may create that illusion for a short while.

For seniors, deferring taxes may make sense because the effect is essentially to reduce that net value of their homes. That will mean their children will have less to inherit, but it is unlikely they will ever have to pay back the deferred taxes out of their income stream.

For young families, the opposite is true.

“Giving them the ability to defer taxes for a long period of time is not going to make the debt go away,” Hannah points out. “It just becomes a bigger burden to deal with.”

The recession has pushed more middle-class families to the brink, Hannah says. In 2008, the average consumer debt carried by people seeking credit counselling was $20,000 to $25,000. Last year, it jumped to $33,000 to $40,000.

Hannah says that the increase was because the people getting into financial trouble had higher incomes and were able to borrow more: “So it’s a growing problem.”

Hannah says for people who understand the ramifications of what they are doing and who are facing a short-term crunch, tax deferment may be useful.

But for people who already have trouble managing money, it may only add to their troubles.

Many young families have large mortgages obtained at historically low interest rates. As those rates inevitably rise over the next couple of years, they will face what are in many cases dramatically higher payments. If they defer taxes now, the added burden of paying them later will be compounded by the pain of higher interest rates.

“All you are doing is mortgaging future paycheques,” he says.

If the option is available, it will be taken by people who don’t fully understand what they are doing.

“If you look at typical consumer behaviour, they are going to take the path of least resistance,” he says.

The only real way to make taxes less of a burden for young families is to reduce them. That isn’t happening.

So if people find they can’t afford to pay their taxes, they may have to take a hard look at whether they can really afford to own their own home.

That’s not an easy question to face, but for most people, deferring taxes will only make it harder.

© Copyright (c) The Vancouver Sun

No way to cool housing market

Friday, February 12th, 2010

John Morisy
Province

Easier access to the Multiple Listing Service could negate the impact of mortgage-rule changes currently under debate to cool the country’s overheated housing market, Scotia Economics said Thursday.

“Indeed, the potential is there for home-buying conditions to actually become easier over the next one to two years via sharply lower average commission rates that are more in keeping with choices south of the border,” said its note, written by economists Derek Holt and Karen Cordes.

Holt and Cordes argue that the savings from reduced real-estate commissions could be substantial, and could make up a large part of the difference on a down payment if it is changed from a five-per-cent minimum to a 10-per-cent minimum.

For example, a typical five-per-cent commission paid against the average resale price of $345,000 would result in a commission of $17,250. The same home sold at rates offered by the still-tiny discount-broker segment would result in a commission of $1,500, a difference of $15,750.

“Thus, through the interplay between potential shifts in mortgage rules and the Competition Bureau’s challenge, Ottawa is likely to at worst leave buying incentives on neutral terms, or could even instead drive even more stimulative terms, given a low probability of changes to mortgages rules.”

Wednesday, the Canadian Real Estate Association announced it would ask its members to bow to pressure from the Competition Bureau of Canada to allow easier and possibly cheaper access to the Multiple Listing Service.

© Copyright (c) The Province

January foreclosures up 15% from year ago; surge on way?

Thursday, February 11th, 2010

The Associated Press
USA Today

The number of U.S. households facing foreclosure in January increased 15% from the same month last year, and a surge in cash-strapped homeowners who’ve fallen behind on mortgages could be on the way.

More than 315,000 households received a foreclosure-related notice in January, RealtyTrac reported Thursday. That number is down nearly 10% from 349,000 in December, which saw the third highest total since the company began tracking foreclosure data in 2005.

In January, one in 409 homes were sent a filing, which includes default notices, scheduled foreclosure auctions and bank repossessions. Banks repossessed more than 87,000 homes last month, down 5% from December but still up 31% from January 2009.

January marked the 11th straight month with more than 300,000 properties receiving a foreclosure filing. The numbers could stay above that level as unemployed homeowners who have tried to keep up with their mortgages finally start missing monthly payments.

Mortgage financier Fannie Mae reported in late January that the rate of borrowers who have a conventional loan on a house and are seriously delinquent was 5.29% in November, more than doubling the rate of 2.13% in November 2008. Borrowers are considered seriously delinquent if they are past due by three months or more, or are in foreclosure.

“There’s a lot of foreclosures in the pipeline, and the number is going to continue to get bigger,” said Patrick Newport, an economist with IHS Global Insight.

Last month’s foreclosure activity followed a pattern similar to that of a year ago, when a double-digit percentage increase in December was followed by a 10% drop in January.

The dip in January’s numbers may be due to processing delays by lenders during the end-of-year holidays, said Rick Sharga, senior vice president of RealtyTrac, which is based in Irvine, Calif.

“I don’t think it’s an early sign of the coming of the end of the foreclosure crisis,” Sharga said.

A record 2.8 million households were threatened with foreclosure last year, and the numbers are expected to rise to between 3 and 3.5 million homes this year, RealtyTrac said.

Slowing the foreclosure rate is a key step in the recovery of the real estate market and the overall economy. The foreclosure crisis forced the federal government and several states to come up with plans to prevent or delay the process to help delinquent borrowers.

Foreclosed homes are usually sold at steep discounts, so they often lower the value of surrounding properties. Cities lose property tax dollars from foreclosure homes that sit empty and from declining home values, straining local economies. Home prices have stabilized in some cities, but are still down 30% nationally from mid-2006.

Economic issues, such as unemployment or reduced income, are expected to be the main catalysts for foreclosures this year. Initially, subprime mortgages were mostly the culprit, but homeowners with good credit who took out conventional, fixed-rate loans are the fastest growing group of foreclosures.

Among states, Nevada posted the nation’s highest foreclosure rate, followed by Arizona, California, Florida and Utah. Rounding out the top 10 were Idaho, Michigan, Illinois, Oregon and Georgia.

The metro area with the highest foreclosure rate in January was Las Vegas, with one in every 82 homes receiving a foreclosure filing. It was followed by Phoenix and the California cities of Modesto, Stockton, and Riverside-San Bernardino-Ontario.

Copyright 2010 The Associated Press. All rights reserved